Using GIS to Visualize Watershed Priorities in Real Time
Hazen used GIS to surface all the relevant factors comprising stormwater/watershed decision-making to create a dynamic tool for visualizing data and justifying management decisions.
At a Glance
- Hazen developed a dynamic prioritization tool using GIS that displays interactive maps with Key Performance Indicators (KPIs), allowing for immediate visualization of the data, accessible to non-GIS users through a web browser.
- Hazen also developed a PowerBI dashboard with data-weighing options and indexed statistics that allow for real-time prioritization to visualize KPIs that are most relevant to decision-making.
- Using this dynamic tool, Gwinnett County Department of Water Resources can demonstrate the data that determines best-management practices for stormwater watershed management.
Background
With over 400 miles of watershed and nearly one million residents, Gwinnett County is the second-most populous county in Georgia and growing quickly. In response to this growth, the Gwinnett County Department of Water Resources (GCDWR) implemented the Watershed Protection Plan (WPP) to protect its water supply during new development. GCDWR partnered with Hazen to develop a watershed characterization and prioritization process to track and monitor watershed conditions, meet the conservation and restoration goals established in the WPP, and streamline CIP decision-making for projects on county-owned land.

Ryan O'Banion is the Director of Geospatial Services at Hazen. An environmental scientist, he uses GIS and data analysis to help clients make more informed decisions about their water infrastructure and resources.
Related Solutions:
How It Works
Using Python scripting with ArcGIS mapping, Hazen utilized the County’s existing geospatial information—from land use and septic parcels to BMPs and water, sanitization, and stormwater infrastructure—to create an interactive map. Combining the map with external data sources and field investigations, we created a tool for displaying the scores determined by the characterization program. The color-coded map gives a Countywide overview and can be clicked for detailed views of individual watersheds, while the related table can rank watersheds by score, priority, or name. Because the data is regularly updated, the tool represents a repeatable process for characterizing watershed health.
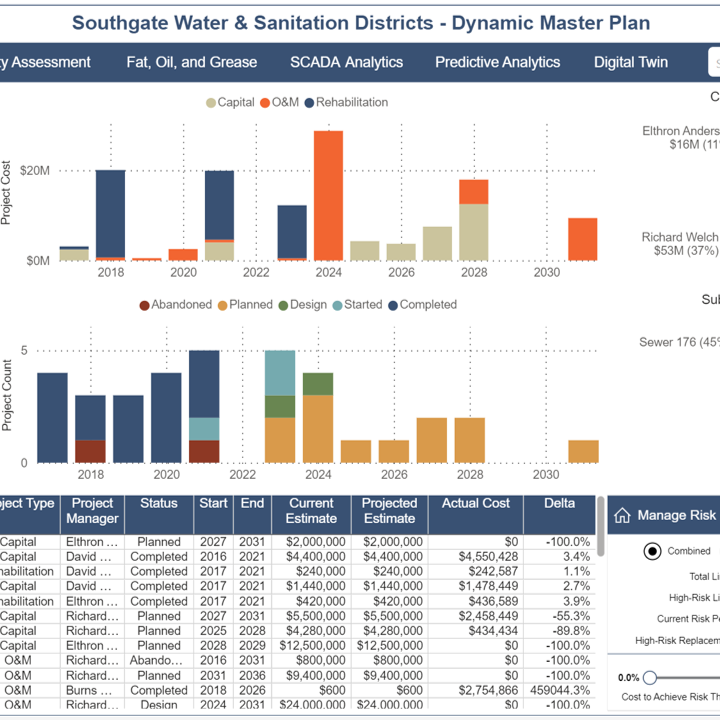
The tool’s main interface is a Microsoft Power BI report that, when variables are altered through interactive sliders, will “reshuffle” to highlight how the County should prioritize its watershed improvement projects. A user can view the watershed with every objective weighted equally to find the area that needs the most overall improvements, or they can shift the weight on various data points to see how it changes watershed health and prioritizes their projects.
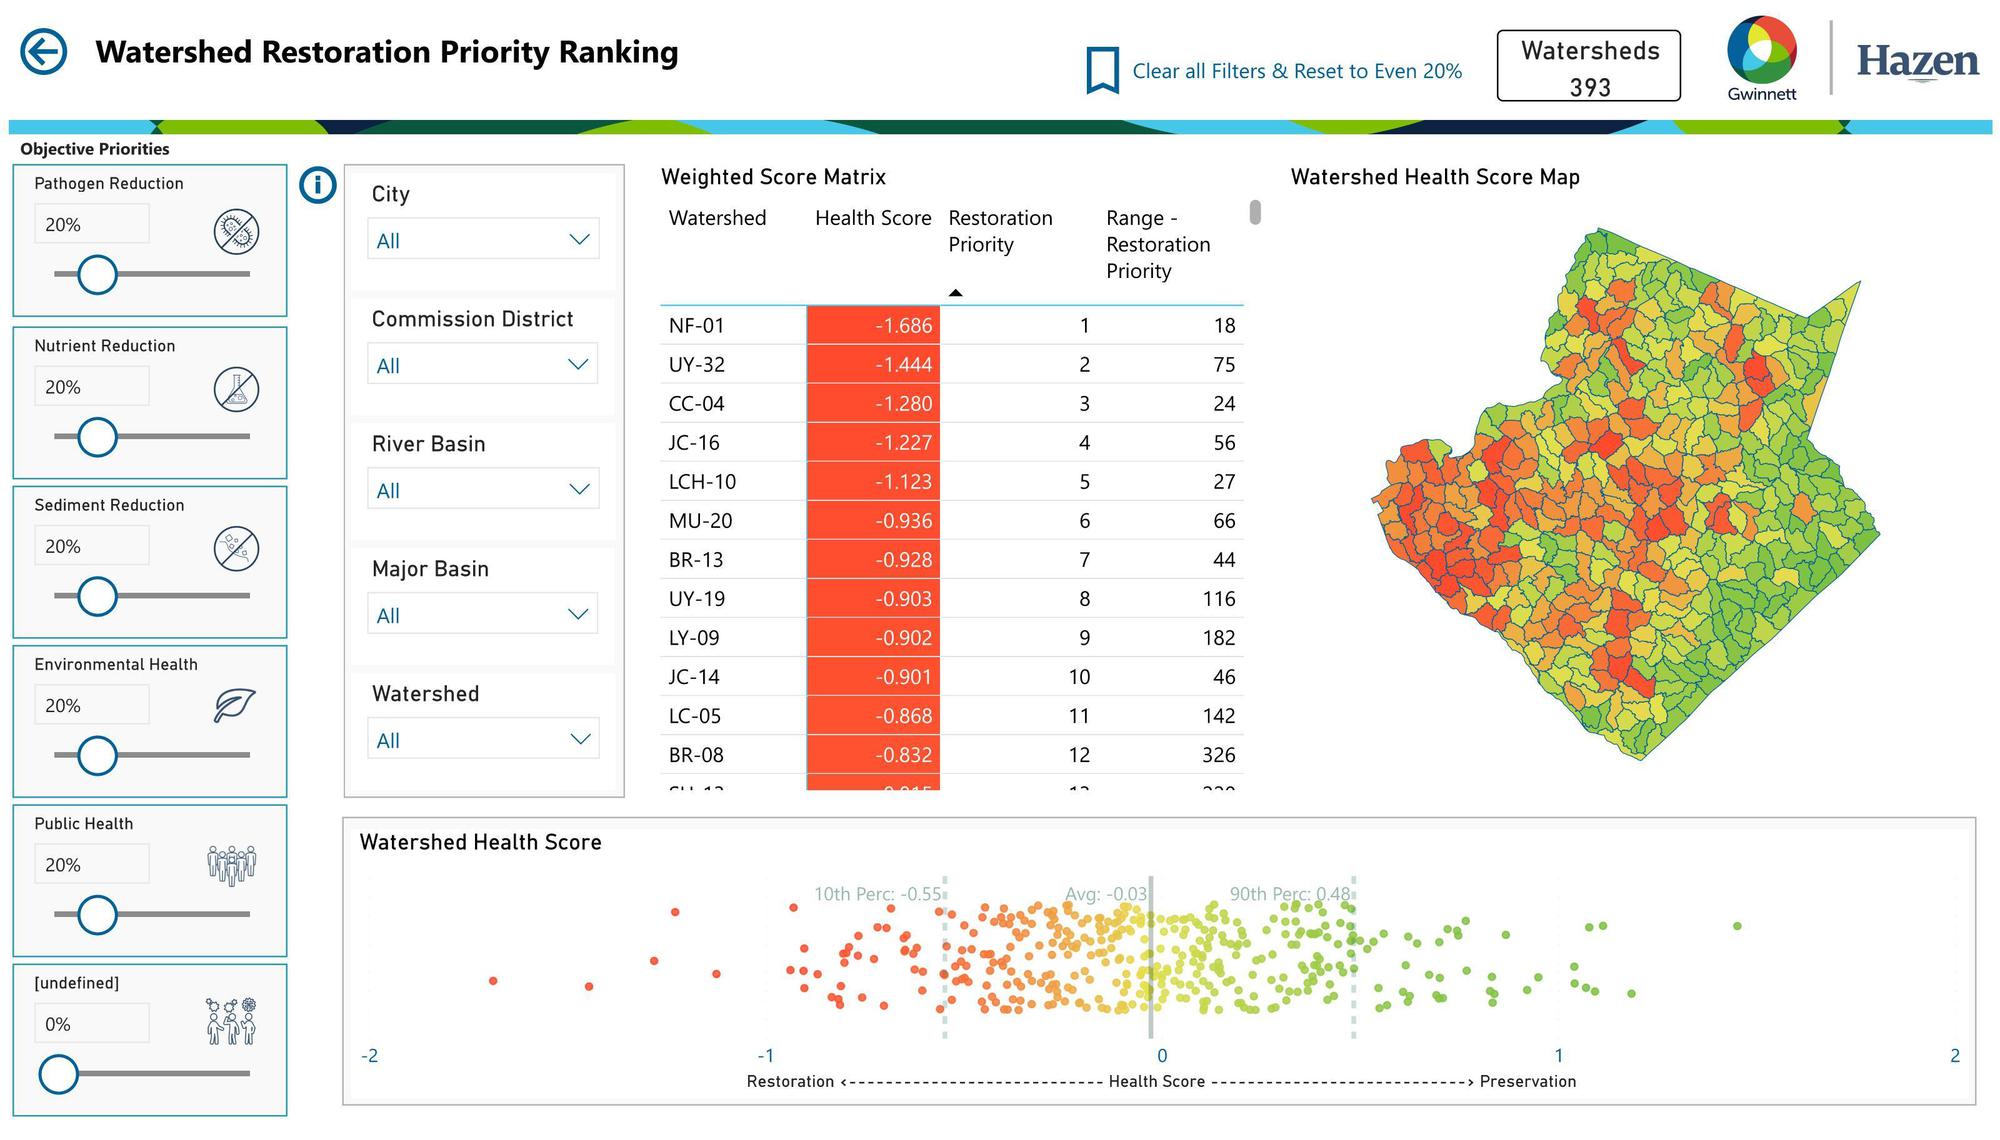
(Above) The Power BI dashboard displaying watershed areas in order of restoration priority. The sliders on the left can adjust weighting according to user needs.
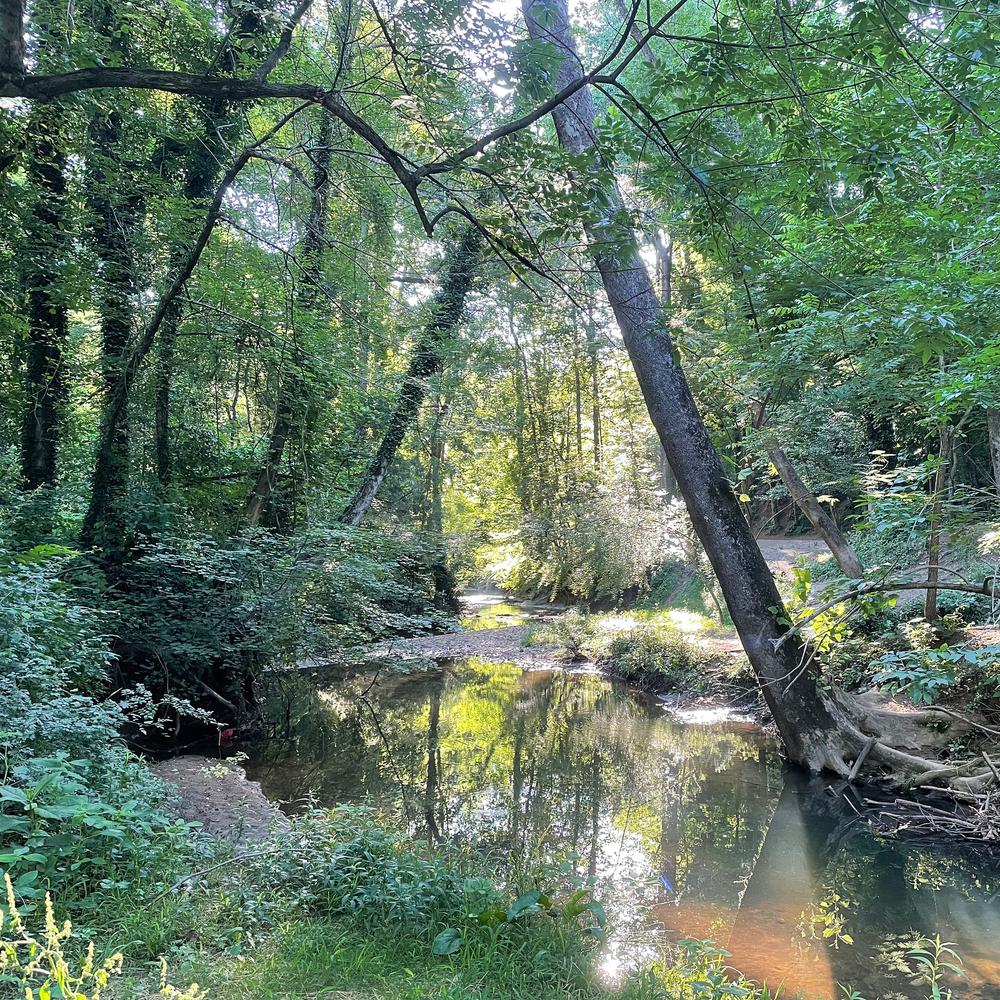
(Top) Photo courtesy of Gwinnett Parks & Recreation.
The Hazen team also developed a way to view supporting documentation and dependencies for each watershed in ESRI ArcGIS, which is accessible even for users who are not experienced GIS analysts. This interactive, web-based dashboard shows users the same details of a selected watershed or mapped area as the digital tool, providing anyone with access important context for how decisions are made.
The final product is a comprehensive, interactive map of the Gwinnett County Watershed. With a touch on this map, a user can view up-to-date data on a region, view its relevant documentation, and use the slider interface to represent diverse scenarios.
Using GIS, Hazen put an attractive, user-friendly overview of the County’s lands and waters in the hands of every staff member and stakeholder.
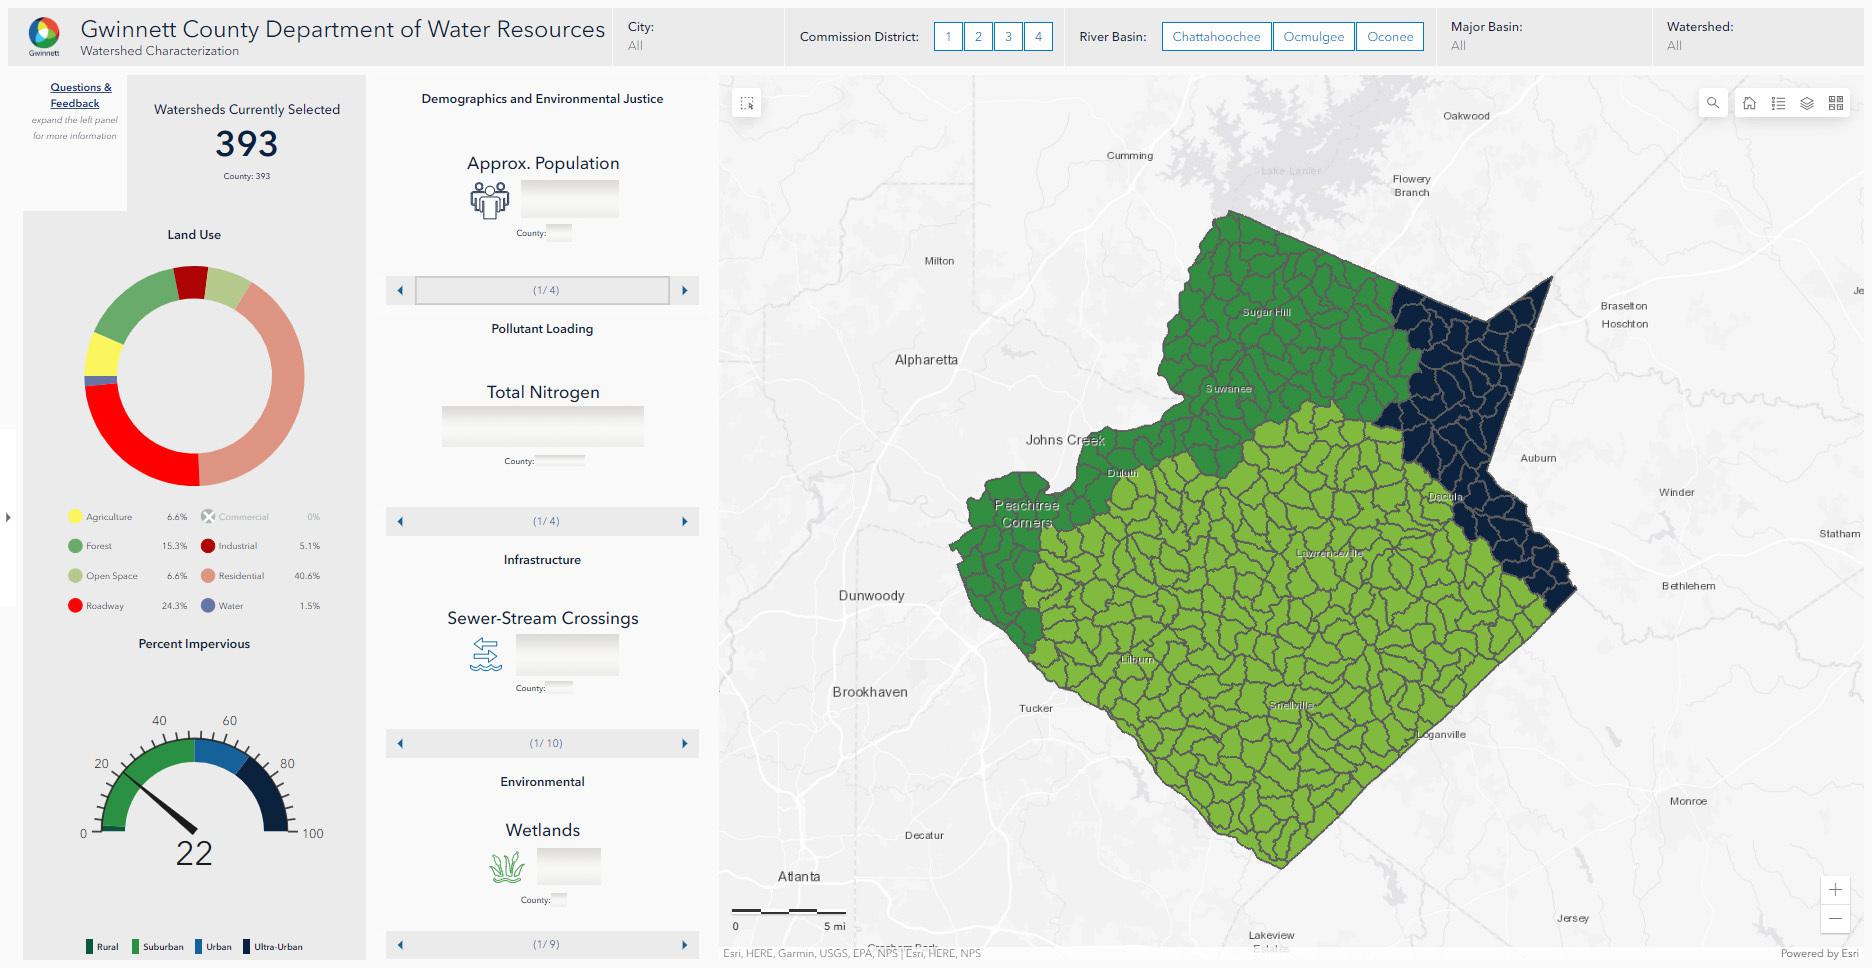
The Esri ArcGIS dashboard displays KPIs for the watershed. Interacting with the map allows users to see data from specific areas, and Countywide will appear underneath for comparison.