NYC Operations Support Tool
The New York City Department of Environmental Protection (NYCDEP) uses OST on a daily basis to assess drought risk for a 19-reservoir system that provides 1 BGD of drinking water to 9 million people. System operators routinely conduct simulations to look ahead at reservoir storage levels months in advance, assess drought risk, and take proactive measures to mitigate low storage conditions.

Grantley Pyke is experienced in data management and visualization, water quality and water resources system modeling, and system operations.
Related Solutions:

OST helped NYCDEP prepare for the extended outage of a major aqueduct that supplies two-thirds of NYC’s water supply. OST analyses were critical in identifying how long remaining supplies can reliably meet water demand, quantifying supplemental water supply needs, and developing forecast-based triggers for demobilizing repair operations when there is a risk of shortfall.

OST has also been used to develop and implement reservoir stream release policies. When hydrologic conditions are favorable, releases are increased to enhance downstream fisheries. When conditions begin trending dry, releases are ramped down to preserve supply reliability. When there is a risk of flooding, releases are increased to mitigate peak spills.

OST’s ability to simulate turbidity in key reservoirs has become a cornerstone of NYCDEP’s strategy for maintaining a high quality unfiltered supply. NYCDEP uses OST to prepare for major forecasted storm events, and to optimize diversions and releases from multiple reservoirs in order to deliver the highest quality water to consumers.
The OST is unique in its ability to support multiple different types of simulations with one system model and one database. Use of the same modeling system to meet both operations and planning needs ensures that all simulations are based on a consistent set of assumptions and baseline system operating rules, and eliminates the need to maintain two separate code bases and model platforms.
Project Outcomes and Benefits
- Automated near-real time data acquisition from multiple sources (e.g. USGS streamflows, NWS forecasts, SCADA reservoir operations data, meteorological stations, in-reservoir and in-stream water quality monitoring sites).
- Timeseries data management system (AQUARIUS) for semi-automated data review/quality control.
- Ensemble forecasting system to generate daily reservoir inflow forecasts extending from the current day out for one year. Multiple types of inflow forecasts are available (NWS HEFS, NWS AHPS, monthly and daily statistical models, and historical/non-conditional).
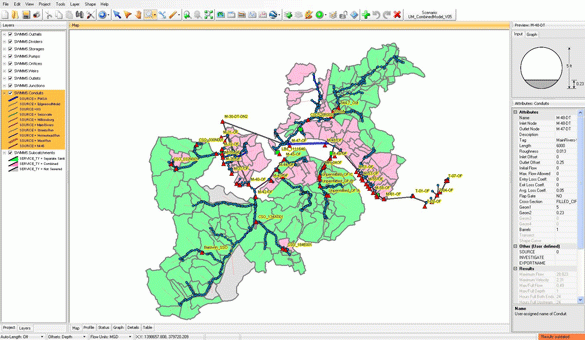
- Reservoir system operations model (OASIS) covering the NYC reservoir system and the entire Delaware River basin. OASIS simulates operation of the reservoir system at a daily timestep, within physical and regulatory constraints, based on system operating rules and objectives.
- Reservoir water quality models for four key reservoirs (based on the CE-QUAL-W2 hydrodynamic model, customized to include turbidity as a state variable), dynamically linked to OASIS, to capture the feedback between water quality and reservoir operations.
- Post-processing and visualization tools, including native OASIS plotting capabilities, a MS Excel-based Analytical Dashboard for data exploration and automated report/presentation creation, and reservoir water quality animation software.