Building Climate Resiliency Coast to Coast
Two pioneering climate resiliency studies, one in Boston and one in Southern California, show how frontline communities can adapt to face future risks.
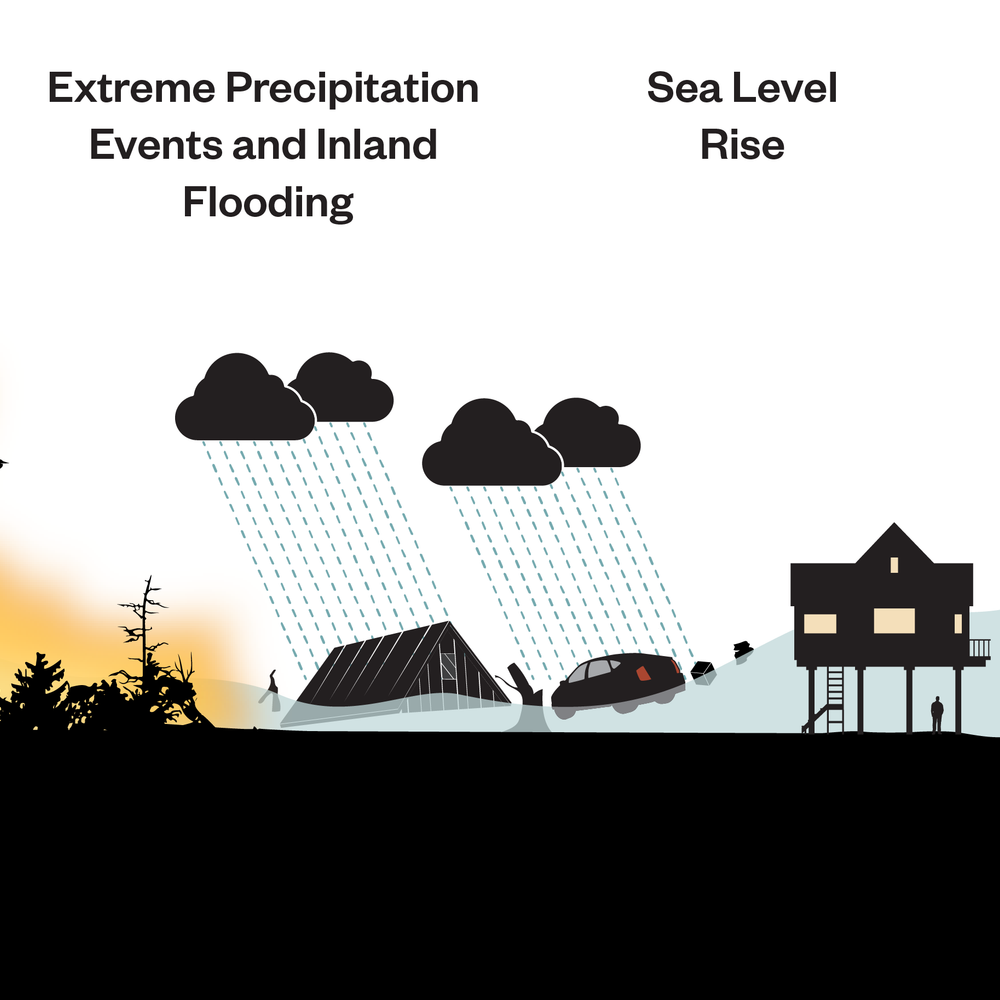
When did the terms “bomb cyclone” and “atmospheric river” enter our national vocabulary? It could’ve been January 2017, when a multi-day atmospheric river in Southern California made headlines with record rainfall that, after five years of drought, triggered flash floods and mudslides. Or the next winter, when a powerful bomb cyclone dropped 17 inches of snow on Boston and flooded the Financial District with a freezing storm surge.
These extreme weather phenomena have forced new terms into our consciousness and challenged communities on the front lines of climate change to find new ways to adapt. While Boston, Massachusetts, and Orange County, California, seem like climate opposites, they are each leading the nation in resiliency planning for critical infrastructure.
Listen as you go
Related Solutions:
(Above) At 1,850 feet long, Orange County, California's Huntington Beach Pier is one of the longest beach piers in the country—and vulnerable to the impacts of climate change.
Hazen created an award-winning Climate Resiliency and Adaptation Plan for the Orange County Sanitation District (OC San) and an Inundation Model and Resilience Hub for the Boston Water and Sewer Commission (BWSC). Both studies helped clients identify vulnerabilities and plan investments to protect infrastructure in the face of extreme climate scenarios. Both projects included visually rich publications to illustrate risks and solutions for a broad audience of stakeholders. And both resulted in human-scale strategies—both engineering solutions and procedures — that will ultimately save lives.
Video: Global water vapor and precipitation data show an atmospheric river carrying heavy precipitation to California in January 2017. Credit: NASA's Scientific Visualization Studio.

A sailboat graces the Boston Harbor, where sea levels have risen 10 inches since the beginning of the Industrial Revolution and could climb multiple feet higher by the end of 2100.
Assessing Risks and Vulnerabilities
In 2017, when Hurricane Harvey soaked the Houston area with more than 40 inches of rain—and up to 60 in some places—the city of Boston was already years into studying solutions for sea-level rise and storm surge caused by climate change. But here was Houston, nowhere near the coast and still inundated with stormwater. Boston’s mayor tasked BWSC with determining how Boston’s stormwater infrastructure would hold up during similar extreme weather events and developing predictions that could be used to evacuate flooded areas before a storm.
Charlie Jewell, Director of Planning and Sustainability with BWSC, remembered that conversation. “The mayor asked us, ‘Where are we going to see flooding? How deep is the water going to be, and for how long? Where do we evacuate people? How do we get ready?’” Jewell recognized that BWSC’s static “bathtub” flood models didn’t account for variations in storms and rainfall intensity across the city. “When he asked us that, we decided we needed a different model.”
BWSC had to reinvent their flood models for these complex storms and previously unheard-of conditions. Hazen Engineer Ben Agrawal recalled being trapped by freezing floodwaters in East Boston during a bomb cyclone. “You can build all these seawalls and barriers and solve sea-level rise,” he explained, “But if you don’t deal with rainfall, there’s still going to be flooding.”
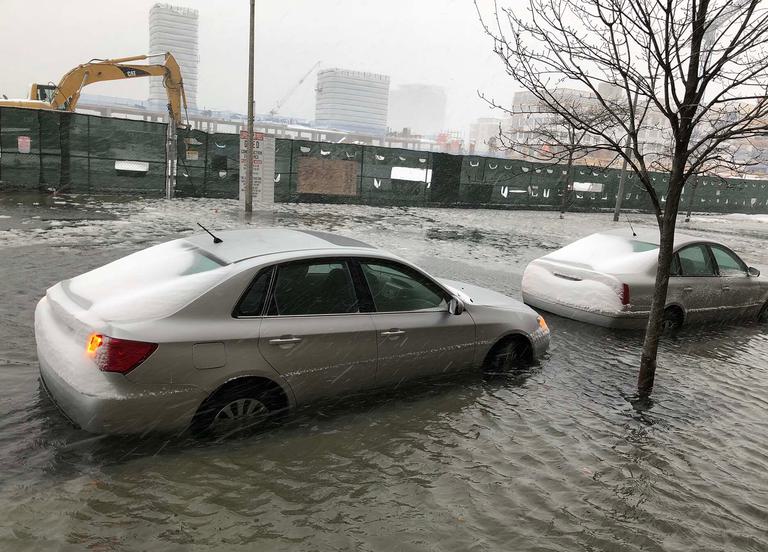
During a January 2018 bomb cyclone, flooding prevented emergency vehicles from reaching East Boston, where Hazen's Ben Agrawal got trapped (and took this photo).
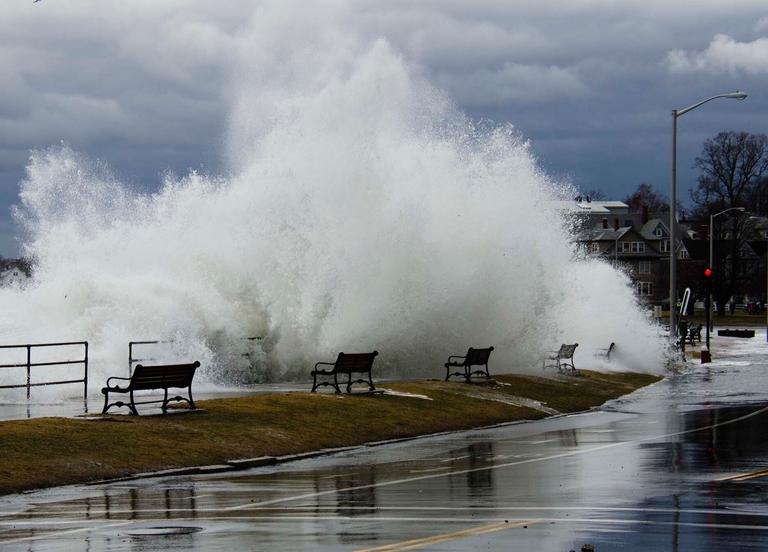
Just two months later, a nor’easter pounded Boston’s north shore with 70 mph wind gusts, heavy rain, and a high tide reaching nearly 15 feet, the city’s third highest.
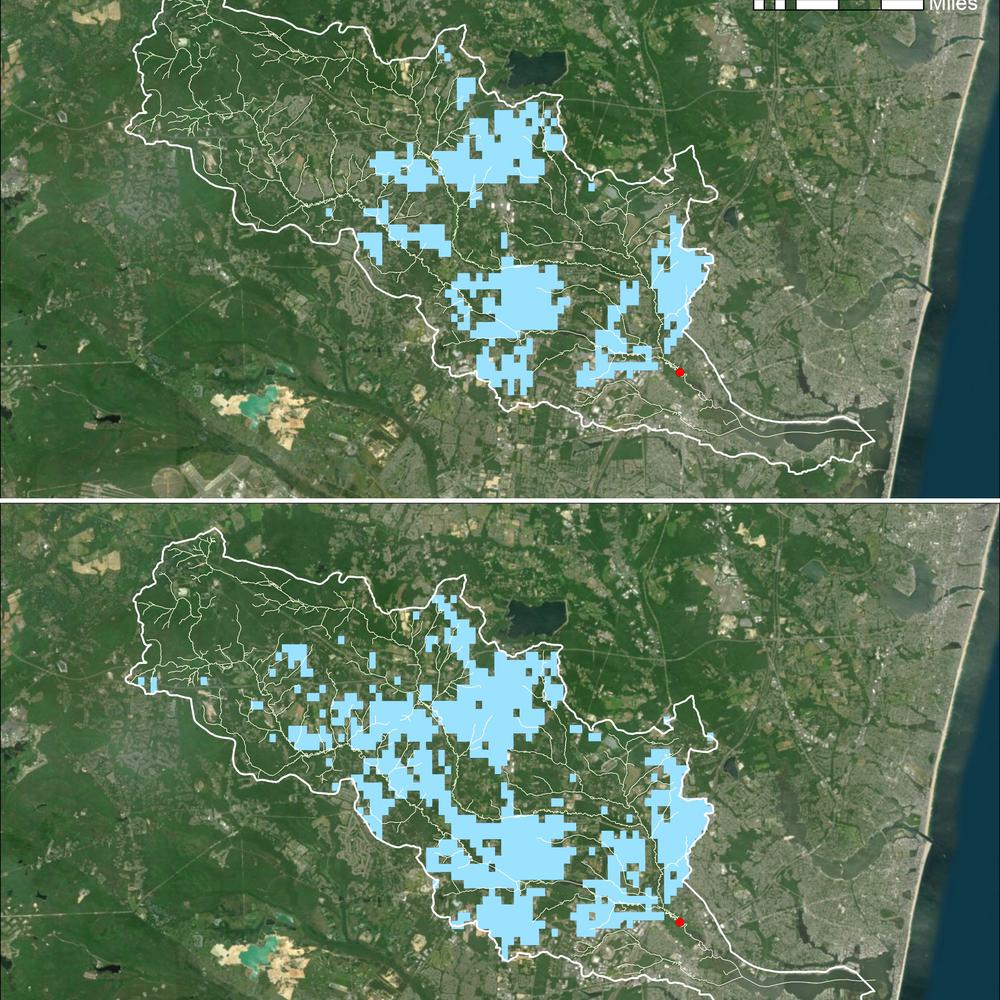
The resulting dynamic flood model gives city leaders the ability to estimate the location, extent, and duration of flooding in multiple extreme weather scenarios. BWSC planners can, for example, quickly isolate impacts to a specific fire station, subway station, or bridge. The model gives users the ability to compare future climate scenarios between 2030 and 2070, toggle between different kinds of storms, and compare catastrophic or nuisance flooding.
Around the same time, OC San commissioned a comprehensive climate change resiliency study, the first of its kind. Like Boston, OC San’s project scope was informed by disasters that hit close to home and highlighted the threats to these communities. Flooding, tsunamis, wildfires, and extreme heat were not theoretical variables, but existing conditions. People were experiencing these major catastrophic events back-to-back.
Nasrin Nasrollahi, a Senior Engineer with OC San, developed the project scope. “The state was asking public agencies to plan for resiliency. We looked at what other agencies and cities were doing, and most were focused on high-level mitigation, reducing greenhouse gas emissions. None of them were planning at this level of detail, from high-level down to electrical and mechanical equipment.”
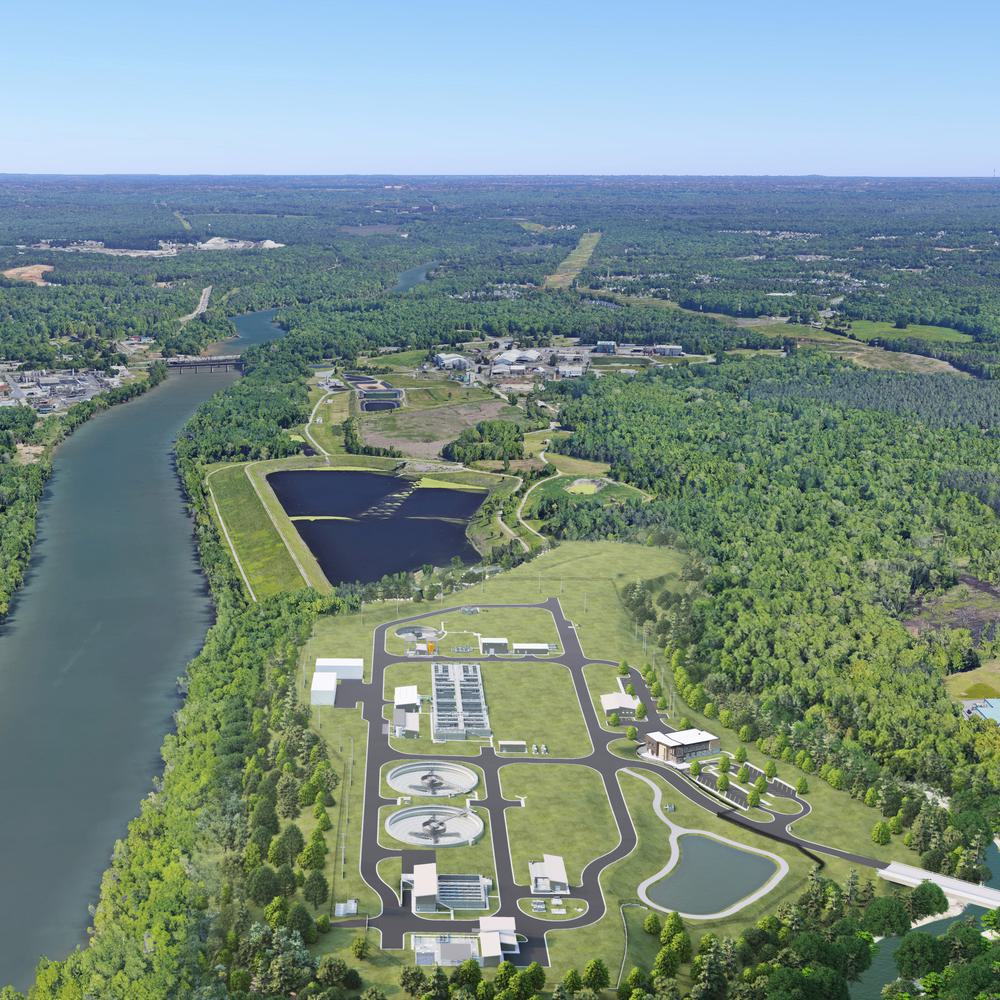
OC San was looking ahead to 2070 to make sure critical assets were protected, both inland and close to the ocean. “Facilities on the coast won’t be impacted by heat the way inland facilities would, even though they’re all one system,” explained Hazen Engineer Michelle Chebeir. Meanwhile, coastal assets were vulnerable to sea-level rise and tsunami.
Along with extensive GIS and climate data analysis, Hazen conducted site visits and workshops with staff to map out a highly detailed, reality-based risk assessment in Orange County. Likewise, in Boston, Hazen visited and analyzed dozens of stormwater outfalls. But this was just the first step in developing a practical plan.
“Everything you see in the Phase 1 model is if we do nothing,” explained Charlie Jewell with BWSC. “It gives you an idea of where the problems are going to be and the range of the problem.” This process began to address the questions that kept the mayor up at night about flooding and evacuations. The next step was finding solutions.
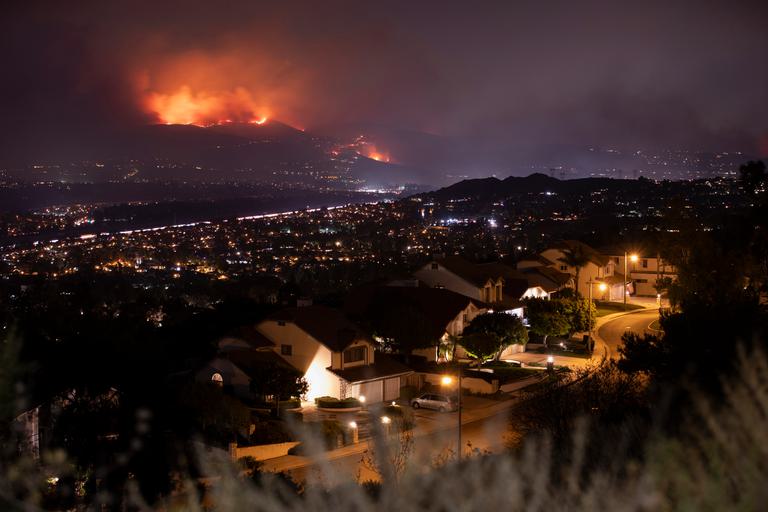
Wildfires like the 2020 Blue Ridge Fire (above, burning near homes in Orange County, California) are a growing hazard in many parts of the country. And they can be exacerbated by other climate hazards, like droughts and wind storms.
Layering Adaptations
In Orange County, multiple risks required layered adaptation strategies. Early in the project, Chebeir was struck by how vulnerabilities pile up. “We started to see the interplay of climate change phenomena—wildfire, extreme heat, winds—not just looking at them on their own.” Santa Ana winds can exacerbate wildfires, for example, leading to damaged and downed power lines. When subsequent blackouts occur, what are the steps to keep critical infrastructure online?
Each facility faced different risks that required different adaptation strategies. From the boundary level—protecting property with floodwalls and flood gates, for example—down to floodproofing individual assets, the plan outlined where to take action and make investments.
“You can’t fix the whole system, but you can adapt,” said OC San General Manager Rob Thompson. “It’s not just engineering fixes, but procedures. Whether it's tsunami, flooding, seismic, they're all challenges we're facing. OC San never tries to solve one problem at a time.”
BWSC also needed to address multiple climate risks with an integrated roadmap. The initial flood model led to a second study, the Coastal Stormwater Discharge Analysis, a roadmap for how to adapt the BWSC’s highest priority outfalls.
Above and below: Hazen engineers visit and document BWSC stormwater outfalls for the Coastal Stormwater Discharge Analysis in April 2021.
By analyzing vulnerable outfalls alongside shoreline protection plans developed by Climate Ready Boston, The Boston Resilience Hub shows risks from, and ways to adapt to, sea-level rise, storm surges, and extreme rainfall. The Hub demonstrates the positive impact of layering different measures to prevent major flooding.
“The system is an old and established system,” explained Jewell, referring to Boston’s historic sewer pipes, half of which are approaching a century old. “We are not going to rebuild this entire system; we can’t afford to. So the question is, how do we use the system that we have as efficiently and effectively as possible? These are tools that I think will help us answer that.”
Sharing the Story
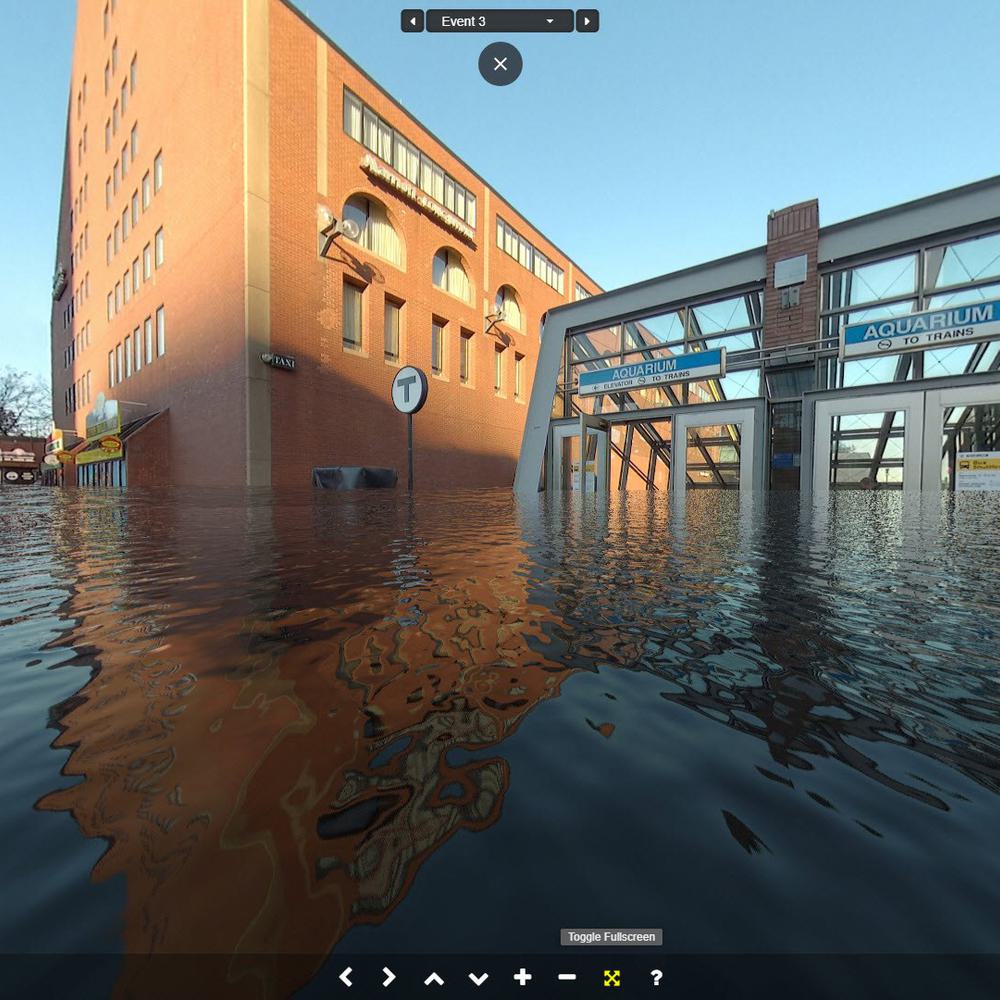
BWSC’s Inundation Model Viewer includes stunning 360-degree street views of simulated flooding. It’s chilling to see popular destinations like the New England Aquarium and the Quincy Market underwater. While typical flood models illustrate the potential impacts from a bird’s-eye view, these street-view images present the threat in a way that’s instantly meaningful and understandable.
For both policymakers and the public, the Boston Resilience Hub shows that the scale of climate adaptation is beyond the capacity of one city or agency and requires regional collaboration. The Hub is available for city staff to compare adaptations, educate decision-makers, communicate with the public, and to galvanize efforts to fund solutions. The power of the Hub is that it brings together shared data, imagery, and people to inspire greater collaboration and change.


BWSC's Inundation Model Viewer uses 360-degree street views to show how potential future floods could impact famous landmarks like Quincy Market (shown above in a screenshot from the Inundation Model Viewer).
OC San’s plan also employs powerful visuals to tell the story not just externally, but internally. Nasrin Nasrollahi was surprised by the enthusiasm she saw during interactive workshops with staff and OC San’s diverse board. “Sometimes with a plan that’s 50 to 70 years out, it’s hard to get people’s attention. But everyone was on board.”
Part of this enthusiasm could be attributed to the staff’s personal experience with climate hazards. Lynn Grijalva, a Vice President at Hazen, recalled a site visit to a pump station in Newport Beach, a block away from the ocean. “We were walking around with a senior maintenance worker, and he told us about a time when a sneaker wave came 24 inches up a block wall. It raised an issue that we had not thought about before: When they have floods, what happens to the roads? Is there still safe access?” This worker’s experience inspired a series of cross-section diagrams that illustrated the height of flooding compared to an operator.
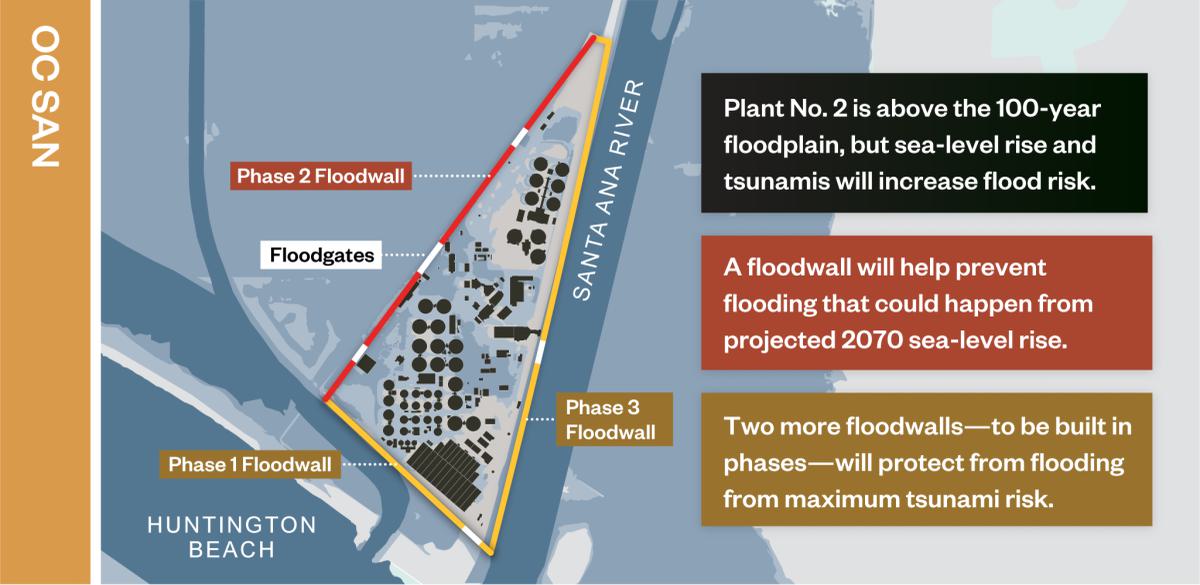
OC San will build floodwalls in three phases (above)—one of multiple strategies the utility is using to mitigate increased flood risk from sea-level rise and tsunamis.
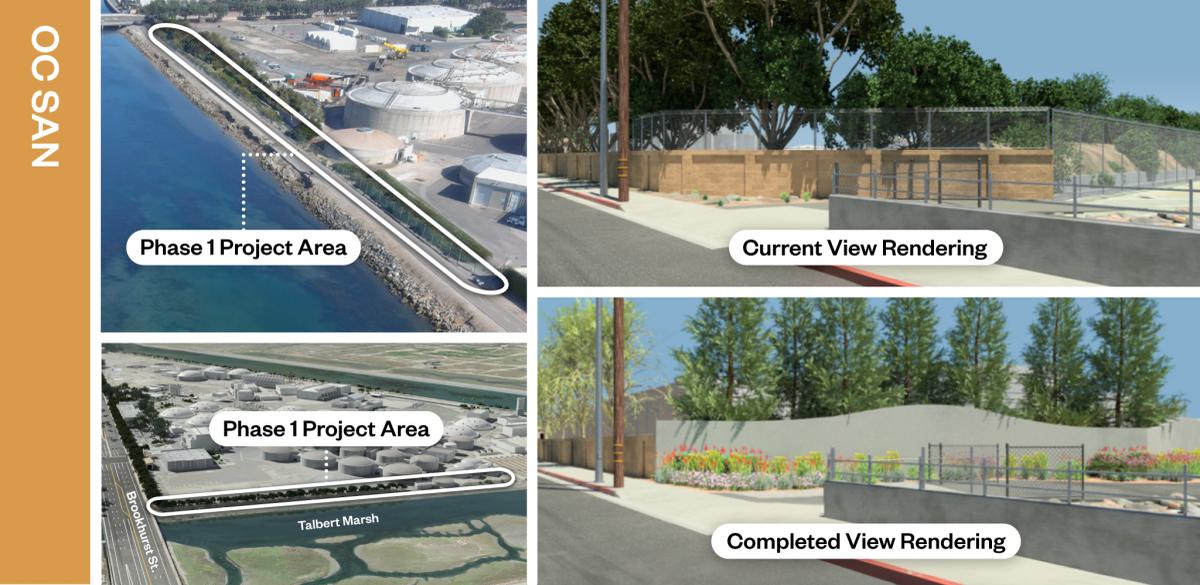
Left: Aerials showing where one of the future floodwalls will stand. Right: Renderings of how one of the floodwalls could look before and after construction.
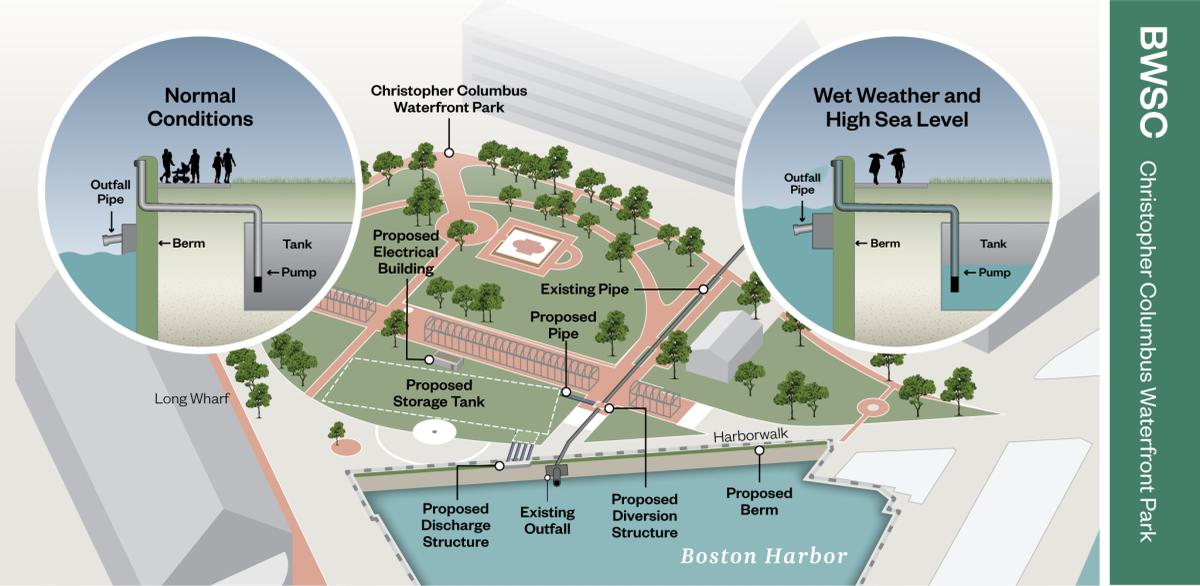
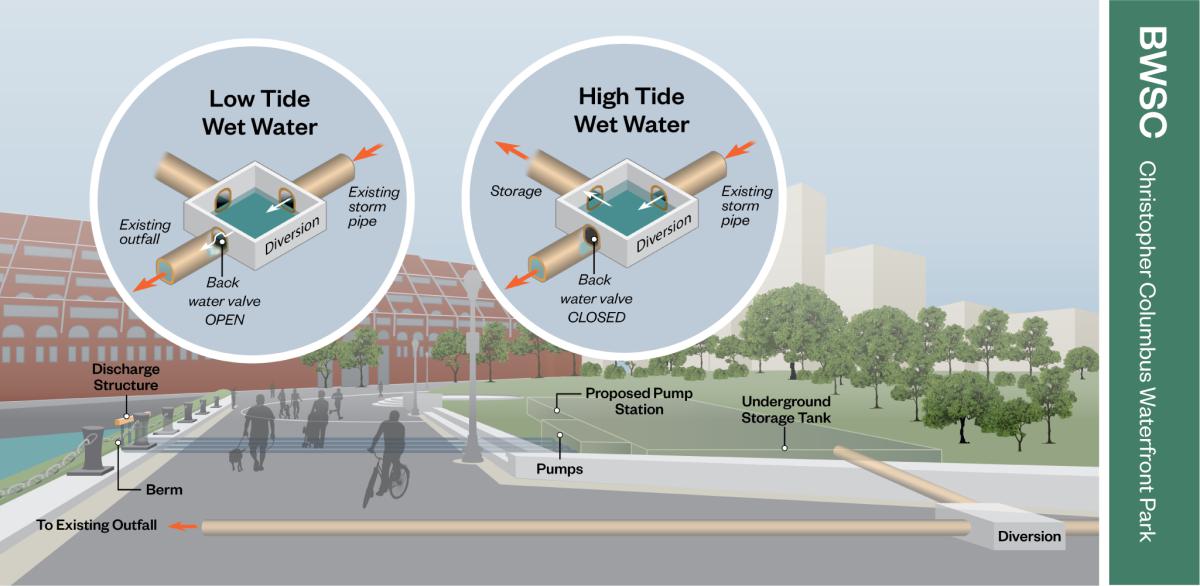
A series of visuals (like the one above) helped BWSC show the public how proposed changes to stormwater and wastewater system could protect Boston from the effects of climate hazards.
Another view of the resilience solutions proposed to protect Boston's Christopher Columbus Waterfront Park.
Protecting Lives
Whether it’s tourists in Boston’s 360° street-view simulations strolling knee-deep in floodwater or a plant operator in Newport Beach during a storm surge, these studies highlight the way climate hazards impact people.
OC San is already implementing recommendations from their plan, both immediate and long-term. From designing a seawall to protect a coastal treatment plant to relocating electrical assets from a basement that could potentially flood, these adaptations are part of a single work plan that guides the agency. The Boston Resilience Hub helps planners evaluate the maximum benefit and offers a hopeful vision based on granular data and realistic options. It shows that it’s possible to prevent major flooding due to climate change.
These two projects offer examples that other utilities can adopt to become more climate resilient.
As Rob Thompson at OC San put it, “Our job as planners is to make what was designed for a different world work for the current world.” A world that is ready for bomb cyclones, atmospheric rivers, or whatever comes next.

Orange County Sanitation District General Manager Rob Thompson leads staff in an annual earthquake drill in October 2019. Credit: Orange County Sanitation District.