Planning for Future Risks in Southern California
Climate Resilience at Orange County Sanitation District
Last Modified Aug 06, 2024
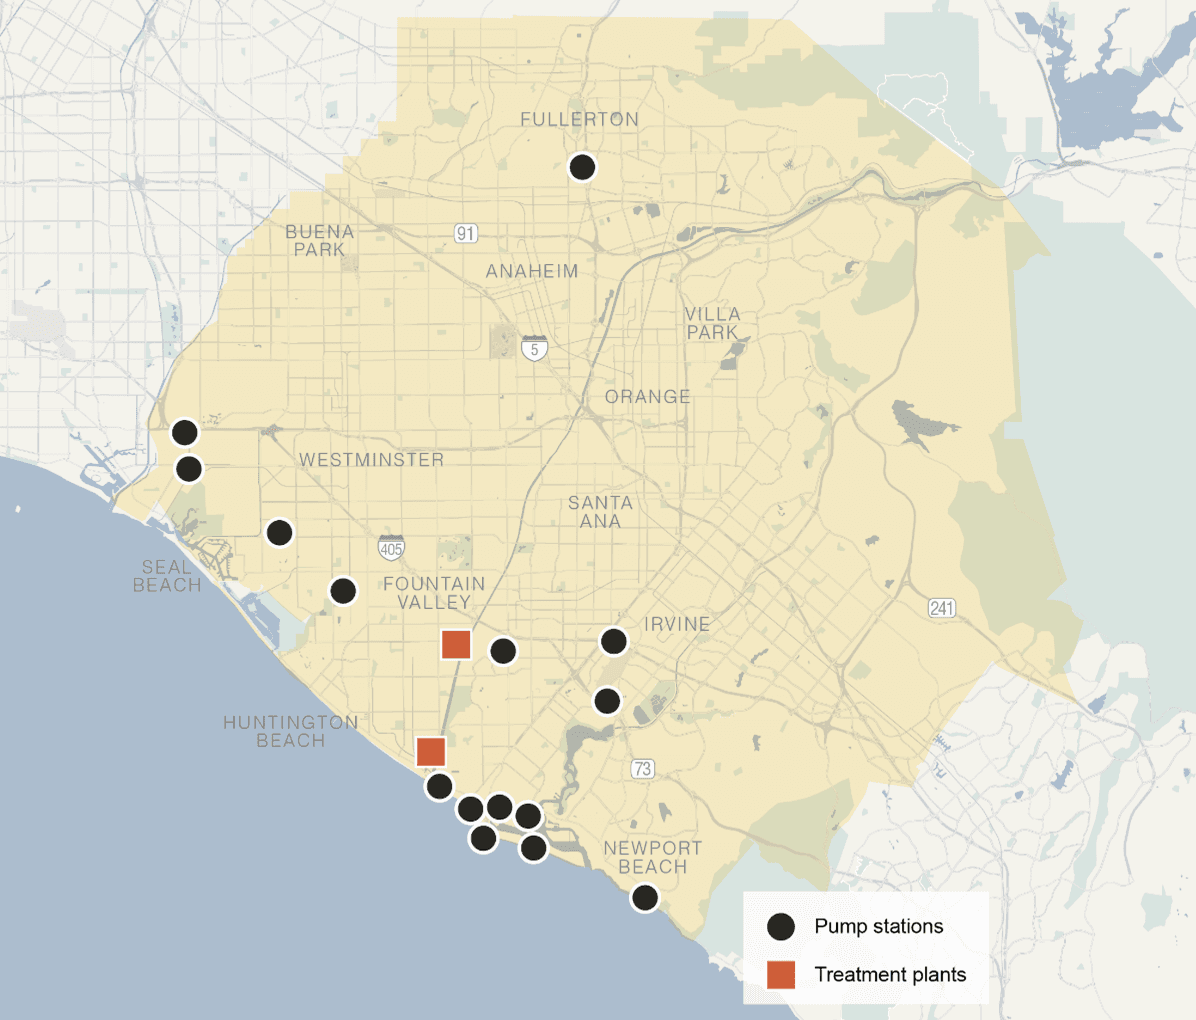
Orange County Sanitation District (OCSD) operates two treatment plants and fifteen pump stations in coastal and inland communities in Orange County, California (Figure 1). OCSD’s Plant Nos. 1 and 2 are located along the western side of the Santa Ana River, with Plant No. 1 located 4.5 miles upstream of where the Santa Ana River meets the Pacific Ocean and Plant No. 2 located just inland of where the river and ocean meet. Climate change threatens to increase the risk posed by natural hazards to OCSD facilities – risks that have serious implications for public and environmental health within and around OCSD’s service area. To minimize the risks posed by climate change to OCSD facilities, OCSD has undertaken a Climate Resiliency Study that involves assessment of the risks posed by climate change and development of adaptations to mitigate those risks.
All of OCSD’s treatment plants and pump stations were evaluated for the risks posed to their operations by flooding, tsunami, wildfire, and extreme heat, and how climate change is expected to exacerbate these risks. Flood risk was evaluated by first determining Federal Emergency Management Agency (FEMA) 100-year flood levels associated with OCSD facilities. Data from California’s 4th Climate Change Assessment was used to develop projections for sea level rise (SLR) for 30-year and 50-year planning horizons, corresponding to years 2050 and 2070. The risk of flood during a 100-year storm without SLR (i.e., the current 100-year flood risk) and the flood risk with SLR in 2050 and 2070 were evaluated for all OCSD facilities using GIS mapping techniques. This analysis allowed the flood pathways into facility boundaries to be identified and marked for a more detailed assessment of flood pathways into individual buildings. Flood pathways into individual buildings were identified by extracting elevations of doorways, louvers, and other openings for water flow into a database so that those elevations could be compared to projected flood levels. Record drawings for buildings with flood pathways below projected flood levels were further evaluated to extract elevations of critical assets and identify their flood risk.
Tsunami risk was identified for OCSD facilities by identifying tsunami runup elevations using the American Society of Civil Engineers Tsunami Hazard Tool. The tsunami runup elevations were compared to OCSD facility site elevations using GIS mapping, similar to the analyses performed for 100-year flood and SLR flood risk.
Numerous facilities were identified as impacted by a 100-year flood with SLR, including many buildings at OCSD’s Plant No. 2 and four pump stations located mostly near the coast. Six pump stations and Plant No. 2 were identified as being at risk of flooding due to tsunami. Most impacted facilities were located at lower elevations, near the coast or enclosed bays, and Plant No. 1 was found not to be impacted by flooding with SLR or tsunami.
Existing adaptations to climate risks were identified in OCSD emergency response plans and design guidelines. Although OCSD’s existing design standards and emergency response plans already contained adaptations to flood conditions due to storms and tsunami, opportunities were identified for increasing resilience though evaluation of additional adaptation strategies.
Four categories of adaptation strategies were evaluated for OCSD facilities: boundary-level, building-level, operational-level, and asset-level. Boundary-level adaptations consisted of flood walls and flood gates. Building-level strategies included stop logs, concrete barriers, and combinations of the two. Operational-level strategies included sandbagging, and asset-level strategies included elevation of assets above projected flood levels or floodproofing of individual assets.
Related Solutions:
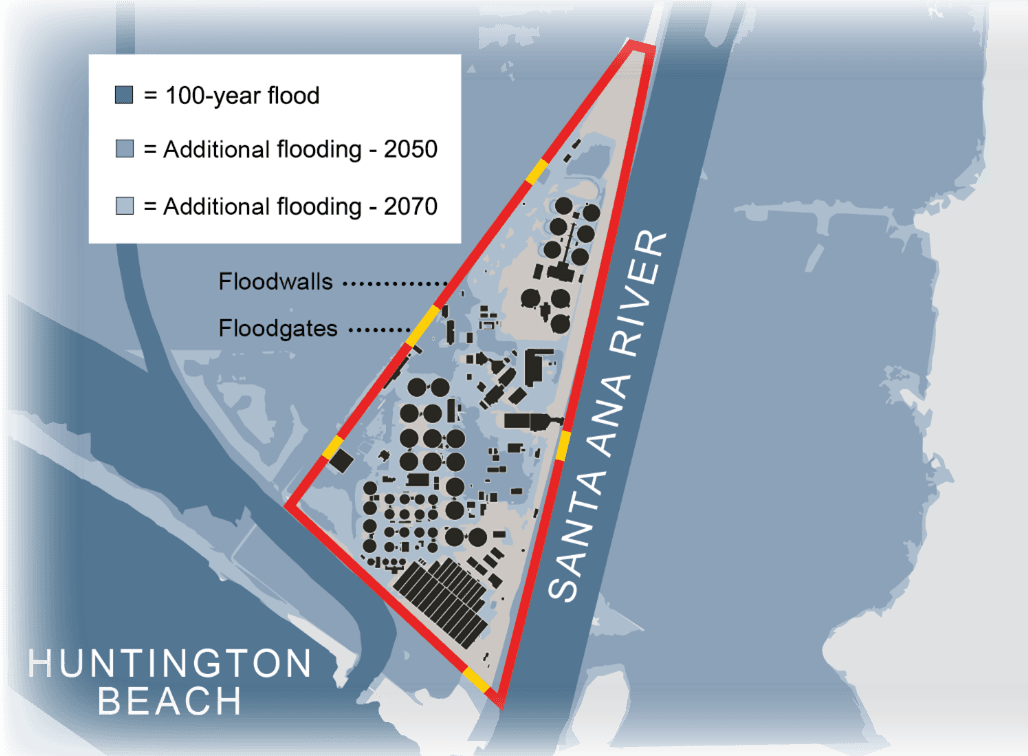
A multi-criteria analysis was performed to determine the most sustainable type of adaptation to use at each facility impacted by flooding. The criteria used in this analysis consisted of adaptation costs, reliability, deployment time, and operational impacts; each criterion was assigned a different weighting through ongoing conversations between consultants and OCSD management. Building-, operational-, and asset-level solutions were considered for all impacted pump stations and for Plant No. 2, but boundary-level solutions were also considered for Plant No. 2. Multi-criteria analysis indicated that the most sustainable adaptation strategy to protect impacted facilities at Plant No. 2 was a boundary-level solution of flood walls and flood gates. The flood wall and gates (Figure 2) would be built to an elevation that will protect the plant against a 100-year flood with projected SLR in 2070 and from the maximum considered tsunami for the region. Multi-criteria analysis indicated that the most sustainable adaptation strategy for impacted pump stations was a building-level solution of stop logs and watertight drywell hatches. The selected boundary-level and building-level strategies were found to protect the highest value of assets while providing a high level of reliability, minimal deployment requirements, and little impacts on operability compared to asset- and operational-level adaptation strategies.
Wildfire and extreme heat risks were evaluated using data from California’s 4th Climate Change Assessment and from the State of California’s Cal-Adapt website, respectively. These data were used to determine the projected annual area burned and number of extreme heat days within the OCSD service area for current conditions and under the 2050 and 2070 planning horizons. Projections showed that some small areas with OCSD facilities are expected to have between 0.25 and 10 acres burned over a 10-year period under the business-as-usual emissions scenario in the 2070 planning horizon. However, wildfire risk was found to be generally low in the vicinity of OCSD’s facilities due to the existence of very little wildland areas near those facilities. The number of extreme heat days was projected to increase from an average of 4 days per year to an average of 11 days per year within OCSD’s service area, based on the business-as-usual emissions scenario, representing an increased but low risk. Due to the low risk posed to OCSD facilities by wildfire and extreme heat, adaptations were not considered beyond those that already exist in design guidelines and emergency response plans.
The presentation will give professionals working in the water and wastewater industry an idea of how to adapt existing facilities to a changing climate and how to prioritize adaptation strategies. The presentation will also inform designers of new facilities on what should be considered for building a new facility that is resilient to climate change. The information presented will help prepare managers of existing facilities and designers of new facilities for the growing requirement of climate resiliency plans in permits issued by regional water quality control boards.