HazenOps Filter Surveillance Tool Optimizes Performance, Cuts Costs
HazenOps Filter Surveillance Tool delivers rapid reporting by combining an ArcGIS Survey123 form, SQL database, and Power BI dashboard in an intuitive, one-system solution.
At a Glance
- The tool allows for efficient, centralized data collection and report creation, ensuring critical details are always captured and used in decision-making.
- Implementation can empower employees to expand their knowledge of the importance of the surveillance process and outcomes.
- By streamlining filter surveillance, utilities can get the most out of their equipment while increasing customer satisfaction and improving regulatory compliance.
Water and wastewater operators traditionally collect filter surveillance data by hand, storing details across notebooks, laptops, and phones. They then must sort the data, put it in spreadsheets, plot it, and synthesize it into reports for key stakeholders. This disjointed and tedious approach can lead to information being unintentionally missed, ignored, or misplaced.
The filter surveillance tool addresses these issues with a streamlined, easy-to-use approach.

Tyler Hudson is a Regional Drinking Water and Operations Assistance Lead, and understands the benefits of empowering operations staff to facilitate optimization efforts.
Matt Charles leads Drinking Water Treatment Operations for Hazen, including filter troubleshooting, optimization, and surveillance training efforts.
Related Solutions:
“We’ve templatized a process that normally requires expert knowledge, making it easier for utilities to maintain their filters on a routine basis.”
Billy Raseman, PhD, PE, Hazen and Sawyer Engineer

How the tool works:
- The ArcGIS Survey123 form—developed in collaboration with Hazen’s filter surveillance experts—prompts field operators to complete a form detailing key observations, metrics, and pictures obtained during physical inspections of the utility’s filters.
- Once the data is entered, operators automatically receive Word and Excel reports in minutes while the system also simultaneously creates a historical record stored in an SQL database.
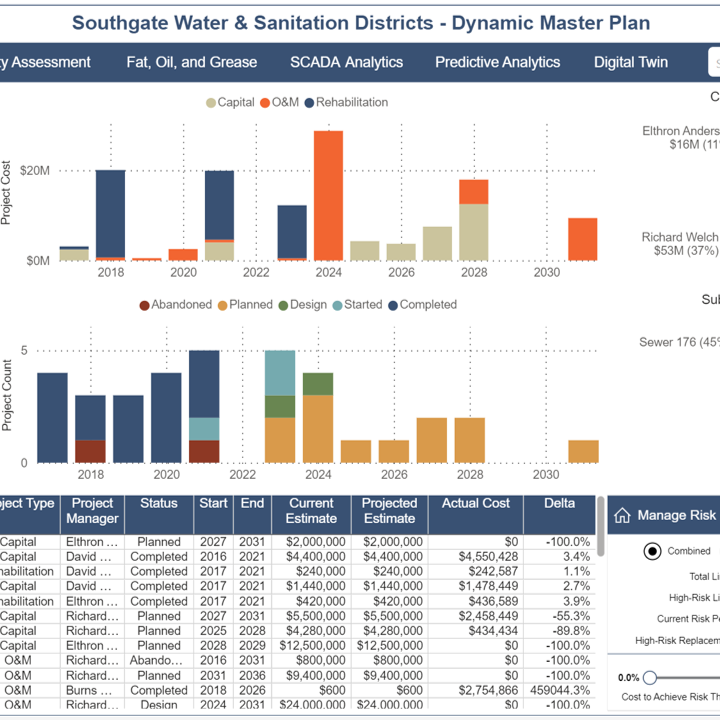
- The Power BI dashboard showcases an overview of all historical data, so stakeholders can gain a clear and concise understanding of their filter operations.

The HazenOps Filter Surveillance Tool streamlines data collection, reporting, and visualization to make this crucial operation quicker, easier, and more accurate. Using it will not only maximize filter efficiency and increase customer satisfaction, but also improve regulatory compliance and staff retention.