El Dorado County (CA) Water Agency Demand Forecast
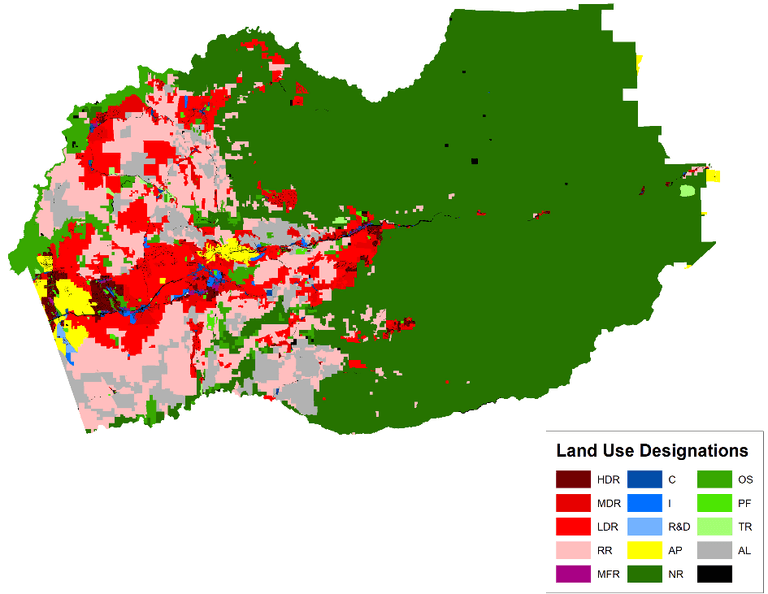
As a subconsultant, Hazen and Sawyer developed long-term water demand projections for El Dorado County Water Agency (Agency) to support multiple water supply planning efforts. The forecast estimated future water needs for the West Slope region of El Dorado County (west of the Sierra Nevada ridgeline and excluding areas within the Lake Tahoe basin) under a scenario of complete acreage build-out according to land use designations.
To produce the forecast:
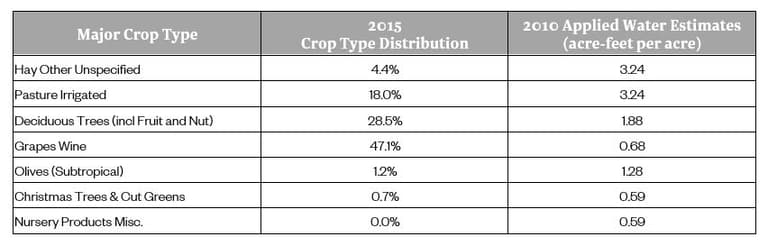
- Agricultural (AG) demands were projected to reflect complete utilization of AG-designated acreage using selected crop types and associated irrigation-per-acre factors.
- Municipal and Industrial (M&I) demands were projected to reflect complete development of non-AG-designated acreage at maximum “build-out” densities specified within the General Plan, using factor estimates of residential demand per housing unit and nonresidential demand per building square foot derived from econometric models.
Residential demand-per-dwelling-unit and nonresidential demand-per-square-foot models were developed using econometric regressions and relied on integration of multiple data sources including:
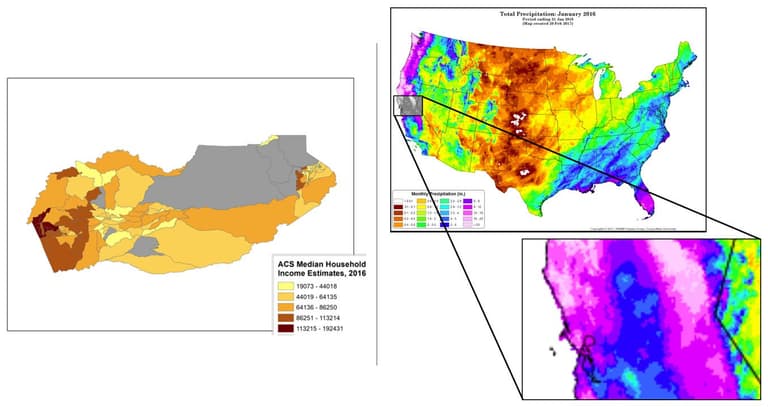
- Parcel-level consumption records and historical water rates provided by utilities within the Agency’s boundaries
- Parcel-level property attributes from the El Dorado County Property Appraiser
- Gridded historical weather data from the PRISM weather group at Oregon State University
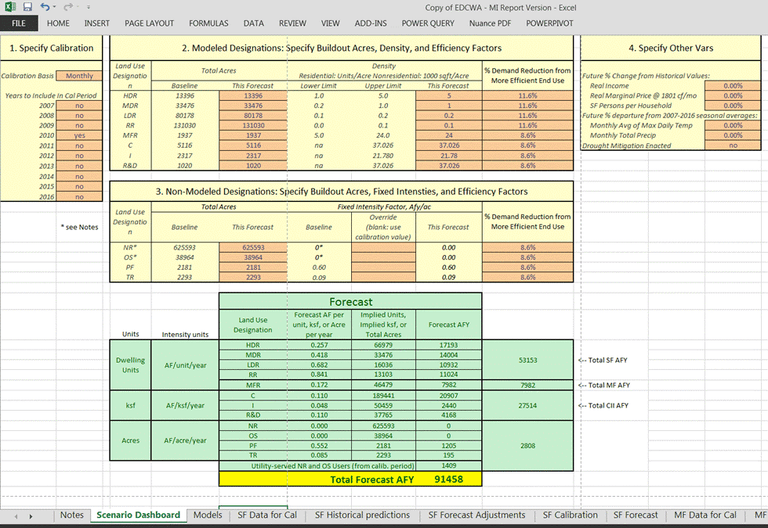
All M&I and AG forecast calculations were implemented in an Excel-based Forecast Scenario Calculator Tool. With this tool, the forecast can be modified to reflect changes in any forecast input, including variables governing demand per acre and forecasted number of acres. This tool allows the Agency to directly explore the sensitivity of their forecasted demand to underlying development and demand-governing assumptions.
Related Solutions:
Project Outcomes and Benefits
- The modeling approach in this effort involved two seldom-combined methods: econometric modeling of demand intensity and consumer units based on detailed future land use designations.
- The model and forecast approach individually addressed a relatively detailed set of sectoral components, including five residential sectors, seven nonresidential sectors, and a significant agricultural sector.
- The Agency was provided with the means to explore ramifications of forecast assumptions on their own.