Cost-Effective P Management
By Coupling Biological P Removal and Nutrient Recovery
Ron Latimer, Paul Pitt, and Christine Yi - Hazen and Sawyer; Gayathri Ram Mohan, Justin Garmon - Gwinnett County Department of Water Resources
Last Modified Sep 22, 2022
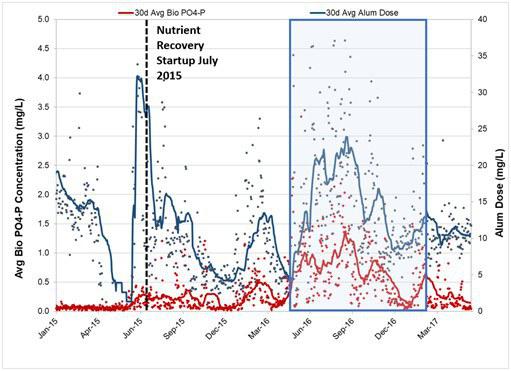
In 2016, the F. Wayne Hill Water Resources Center experienced periodic episodes of increased phosphorus (PO4-P) breakthrough from its bioreactor basins (BRBs). This reduction in enhanced biological phosphorus removal (EBPR) performance resulted in increased reliance on metal salt addition to the mixed liquor and tertiary filtration influent streams. These additions can harm the facility’s struvite recovery performance.
As a result, the facility sought to optimize EBPR with the aim of reducing metal salt addition requirements and facilitating more stable nutrient recovery performance.
Related Solutions:


About the Facility
The F. Wayne Hill Water Resources Center (FWHWRC) is largest and most advanced wastewater treatment facility in Gwinnett County, GA. The facility uses EBPR and chemical polishing to meet a stringent effluent discharge limit for total phosphorus (TP) of 0.08 mg/L. Nutrients — mainly phosphorous, ammonia and magnesium — bound up in the biological sludge are recovered at the facility using the OSTARA Pearl® process with WASSTRIP (Waste Activated Sludge Stripping To Remove Internal Phosphorus) via controlled harvesting of struvite. This recovery also aids in the reduction of phosphorus load recycled back to the mainstream liquid treatment train.
Each BRB is a plug-flow reactor, with primary effluent and RAS addition to an upfront anaerobic zone. This is followed by an unaerated zone (anaerobic or anoxic depending on nitrified recycle (NRCY) operation), then anoxic zones for denitrification and, finally, aerobic zones for both luxury uptake of phosphate and nitrification. Each BRB is also equipped with NRCY or internal recycle that returns nitrified bioreactor effluent to an anoxic zone to enable a reduction in bioreactor effluent nitrate (NO3) concentration and stable anaerobic conditions in the first zones of each reactor. Both anaerobic and swing zones use a vertical-shaft style mixer to ensure adequate mixing of mixed liquor (MLSS) during unaerated operation.
Optimization Approach
The facility began a combination of efforts to resolve issues associated with upsets in EBPR performance. First, they performed a historical data analyses to identify potential root causes of instability. Second, they used process modeling to identify and screen strategies that can improve EBPR, using calibrated process models to simulate process performance under different phosphorus loading conditions to evaluate the impacts of increased TP recycle from the nutrient recovery process. Finally, they completed full-scale testing of different BRB configurations to investigate performance. This included nutrient profiling in the BRBs to assess nutrient removal performance across the BRBs and other process streams. It also relied on micrograph analyses for visual assessment of phosphorus accumulating organism (PAO) and glycogen accumulating organism (GAO) populations.
For each optimization configuration tested, one BRB in each phase was chosen as control (no NRCY) and one as test reactor. The optimization study was divided into eight test periods, each with a different mode of BRB operation for the test reactor. Various BRB configurations were evaluated to determine their effect on EBPR performance and stability, especially during periods of operation when nutrient recovery performance was reduced.

Finding Insight
Based on data analyses, modeling, and full-scale sampling, the project team was able to glean several insights into what was happening during this period of diminished performance.
Strong correlation between EBPR stability and nutrient recovery performance. During the period of EBPR upsets, they observed a strong correlation between EBPR instability and reduced nutrient recovery performance. During these periods of elevated bioreactor effluent PO4-P, microscopic analyses suggested a proliferation of glycogen accumulating organisms (GAOs). These GAOs can compete with phosphorus accumulating organism (PAOs). Cumulatively, these results indicated that the intermittent return of fine particles of struvite from the nutrient recovery process may have detrimental effects on performance of the EBPR process as well as the nutrient recovery system.
Effect of NRCY operation on EBPR performance. During EBPR upset events, facility staff noted that BRBs operating with NRCY tended to perform worse than BRBs without NRCY. For example, BRBs without NRCY were observed to have an increase in bioreactor effluent PO4-P concentrations reaching 1.0 mg/L-P or higher during EBPR upsets and then decreasing to 0.1 mg/L-P or below within 5 to 7 days following recovery. BRBs operating with NRCY, on the other hand, did not recover for up to 12 days.
This result was confirmed through calibrated process modeling. Modeling results indicated that EBPR performance is not expected to be diminished if the primary effluent TP loading is less than or equal to 1,134 kg/d (2,500 lb/d). However, if the primary effluent TP loading increases beyond 1,134 kg/d (2,500 lb/d), BRBs operating with NRCY had poorer EBPR performance when compared to operating BRBs operating without NRCY. This is hypothesized to occur because operation with NRCY can effectively reduce reaction kinetics within the BRBs since the concentrations of substrates (internal and external) are lower.
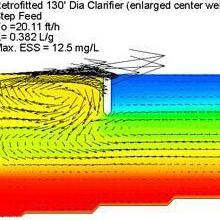
Secondary P release in secondary clarifier (SC) blankets can affect overall performance. In-situ profiling of the bioreactors also revealed periodic elevated concentrations of PO4-P in the return activated sludge (RAS). This indicated that secondary phosphorus release may occur in the sludge blankets of the secondary clarifiers. Subsequent discussion with facility staff revealed that blanket control within the secondary clarifiers had been an ongoing difficulty and that blankets more than 3 m (9 ft) had been observed in the past. Secondary phosphorus release can detrimentally affect EBPR performance because the phosphorus release is not associated with luxury carbon uptake. As a result, the cells returned to the anaerobic zones would be depleted of both phosphorus and internal carbon reserves.
RAS flow and short circuiting. In-situ TSS profiles of each BRB revealed potential short-circuiting of RAS to Zone A2 in the Phase 2 bioreactors. Given the configuration of the bioreactors, both Zones A1 and A2 should exhibit similar TSS concentrations; however, testing confirmed that TSS concentrations are higher in Zone A2 as compared with Zone A1.
Back mixing from aerated to unaerated zones. There is a decrease in PO4-P concentrations in Zone A2 of the BRBs. Since there is no NRCY, this dilution of phosphorus between Zone A1 and Zone A2 is believed to be due to back mixing from Zone B1 (aerobic) to Zone A2 (unaerated). Back mixing of this nature can reduce the effectiveness of the anaerobic and anoxic zones.
Strategies Employed to Address EBPR Performance
Gwinnett County staff have implemented new protocols for operation of the nutrient recovery process (in conjunction with Ostara®) to mitigate fluctuations in nutrient recovery performance.
Improve phosphorus removal in nutrient recovery process. This includes pH modification in the recovery process as a function of magnesium to phosphorus ratio for struvite formation, adjusting struvite harvesting frequency, and periodically seeding the reactors with struvite fines to maintain desired surface area in the reactors. The result is reduced fines production from the nutrient recovery process and, subsequently, less variation in primary effluent TP loading and stable EBPR. This in turn simplifies operations and reduces the reliance on metal salt addition in the mainstream facility.
BRB configuration changes to stabilize EBPR. In the new bioreactor configuration, NRCY is directed to Zone A2. Zone B1 is operating as an unaerated anoxic zone. This allows anaerobic conditions in Zone A1 for EBPR and maximizes anoxic volume to reduce bioreactor effluent nitrate concentrations. It also allows for adequate aerobic volume that will be necessary to maintain a target aerobic SRT of 8 days with existing infrastructure at the facility design rating of 227 million L/d (60 mgd). The configuration also reduces anaerobic HRT, limiting GAO proliferation in the biological process.
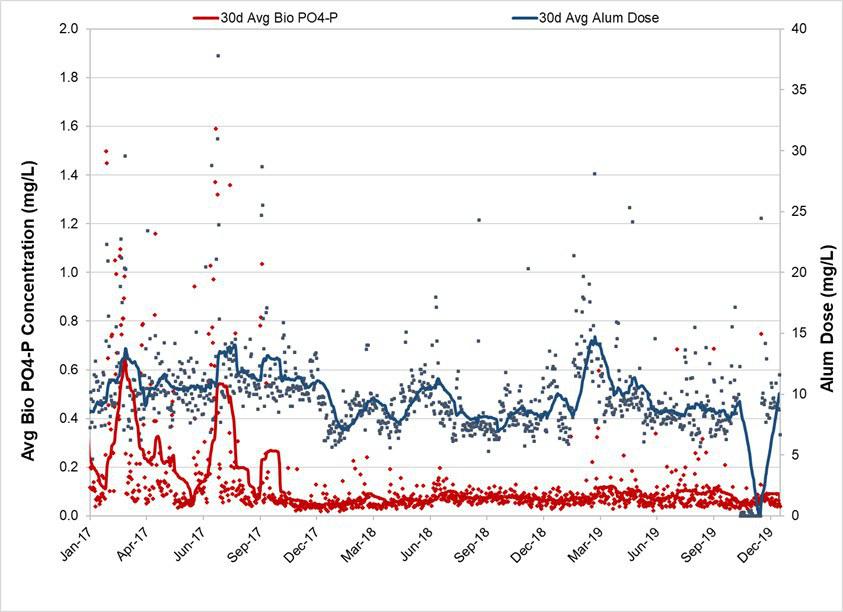
Recent facility performance shows that EBPR performance has improved since November 2017 (end of optimization period). Volatile fatty acid (VFA) speciation analyses performed at the facility have shown that EBPR at FWHWRC is not limited by VFA in the influent, likely due to the length of the collection system and the presence of waste sludge from smaller facilities in the influent to the process. Average bioreactor effluent PO4-P concentrations have remained at 0.1 mg/L-P or lower consistently, with facility operations able to reduce the alum dose to the MLSS to below 10 mg/L.
Excerpted from the January 2021 issue of Water Environment & Technology