Optimization Of Secondary Clarifiers in BNR/ENR Applications
Last Modified Aug 01, 2022
Biological Nutrient Removal (BNR) and Enhanced Nutrient Removal (ENR) treatment plants rely on several microbial populations (heterotrophs, autotrophs, poly-phosphate accumulating organisms, etc.) to achieve Nitrogen and Phosphorus removal. Some of these populations, e.g. aerobic autotrophic bacteria responsible for nitrification, have lower growth rates and therefore are more difficult to restore in the event of solids washout that could happen in wet-weather storm flows. The retention of the solids inventory and maintenance of the microbial population in a healthy and viable state is therefore critical in ensuring adequate treatment after the storm event has passed.
Secondary clarifiers are a key unit to ensure retention of the solids inventory. The performance of clarifiers depends on several interrelated processes and factors including: hydrodynamics, settling, turbulence, flocculation, sludge rheology, atmospheric conditions, tank geometry, internal features and loading conditions. Despite being a key unit process to ensure successful treatment in BNR/ENR plants, clarifiers have traditionally been designed following simplistic approaches. Computational Fluid Dynamics (CFD) is the most advanced technique available today for clarifier design, troubleshooting and optimization. It is the next generation tool that can incorporate all the major processes and factors affecting clarifier performance. This paper will illustrate the calibration and application of CFD modeling to four different BNR/ENR case studies covering a wide variety of clarifier geometries, internal configurations and loading conditions.
Methods and Procedures
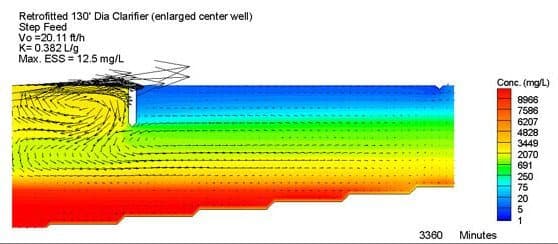
Case Study 1 – 15 MGD Annual Average Daily Flow (AADF) Virginia WWTP: a calibrated CFD model was used to evaluate wet-weather strategies that will prevent solids washout during peak flow events in a 15 MGD AADF BNR facility. Step-feed operation, polymer addition and different clarifier modifications were analyzed for the existing 130-ft diameter secondary clarifiers. Dynamic MLSS predicted by a calibrated BioWinTM model were used during the simulations. Modeling results show that the performance of the existing clarifiers is limited by particular geometric features that include a small center well and a relatively shallow tank (side water depth is 12 ft). Different modifications and strategies were proposed and evaluated in order to retrofit the existing 130 ft diameter secondary clarifiers.
Case Study 2 – 75 MGD AADF North Carolina BNR WWTP: this case study illustrates the application of stress testing and CFD modeling for the evaluation of the effect that tank depth has on clarifier capacity. Existing 11-ft side water depth (SWD) and 15-ft SWD peripheral feed clarifiers were stress tested side by side and evaluated using CFD modeling.
Case Study 3 – 26.5 MGD AADF Florida BNR WWTP: for Case Study 3, a calibrated CFD model was used to compare the performance between optimized center feed and peripheral feed clarifiers in a 26.5 MGD AADF BNR facility. Clarifier capacity for both types of clarifiers was evaluated for different loading conditions and different SVIs.
Case Study 4 – Evaluation of Rectangular Clarifiers: this case study presents the evaluation of rectangular clarifiers. A calibrated CFD model was applied to improve the performance of 200-ft long by 68-ft wide by 12-ft deep rectangular secondary clarifiers. The clarifiers are provided with an influent target baffle and a single transversal launder.
Results and Conclusions
Case Study 1: the results demonstrate that the use of step-feed considerably decreases the clarifier solids loading rate and results in lower effluent suspended solids (ESS). During the evaluated storm event, the maximum ESS without step-feed was approximately 160 mg/L while step-feed reduced the ESS to 55 mg/L. Retrofitting the clarifiers with an enlarged center well and polymer addition can further reduce the ESS to 10 mg/L. Figure 1 shows the performance of the existing and retrofitted clarifiers.
Case Study 2: Figure 2 shows the predicted ESS for the 11-ft and 15-ft SWD tanks at different surface overflow rates (SORs). The results indicate that, during poor settling conditions, the SOR to the shallow clarifiers needs to be restricted to approximately 820 gpd/ft2, while the deeper tank achieves acceptable effluent quality even at SOR slightly over 1,000 gpd/ft2.
Case Study 3: as shown in Figure 3, the results demonstrate that well designed peripheral feed and center feed secondary clarifiers perform similarly. Further, the results demonstrate that sludge settleability is the single most important factor affecting clarifier capacity in well designed units. Figure 4 shows the clarifier performance at different SVIs.
Case Study 4: the modeling results indicated that clarifier performance is satisfactory at design MLSS of 1,200 mg/L, but it is compromised as the MLSS concentration approaches 2,000 mg/L when the SOR approaches 1,200 gpd/ft2. The poor performance is due to poor flocculation and hydrodynamic limitations. Figure 5 shows the model results for the evaluation of the existing clarifiers. To improve performance, different modifications were configured and evaluated. The results show that the definition of a flocculation zone, by replacing the target baffle with an inlet skirt, had a major benefit on the tank performance. Additionally, replacing the single transverse launder by multiple longitudinal launders reduces the weir loading rate and increases capacity. Figure 6 shows the model output for the evaluation of the retrofitted secondary clarifiers.