Assessing and Visualizing Extreme Storm Event Inundation in Boston
Charles Wilson and Benjamin Agrawal - Hazen and Sawyer, Charlie Jewell and John Sullivan - BWSC
The Boston Water and Sewer Commission (BWSC) has taken a critical step in advancing their understanding of potential impacts of extreme storms on flooding across the City. BWSC has undertaken a project to develop a two-dimensional (2D) model using PCSWMM software, designed to predict the extent and duration of flood inundation within the City of Boston for a variety of wet weather events. Other tools, including Microsoft Power BI and ArcGIS StoryMaps, are being used to manage and display model results using interactive dashboards and mapping. The results of this model could be used (by the City and/or other agencies outside of BWSC) for identification of land area, buildings, transportation infrastructure and other facilities that will likely be impacted by major events, as well as for evacuation, adaptation, and resiliency planning.
The model uses precipitation data with high spatial (speed and direction) and temporal (distribution of rainfall over time) resolution for dynamic design storms of various intensities, durations, and depths. The City’s collection system infrastructure is composed of a sewer system (partially combined) and a storm drain system, each of which has outfalls that are subject to tidal fluctuations and vulnerable to storm surge. The model dynamically predicts the flow and levels throughout the sewer and drain system and can simulate conditions which surcharge the systems and cause flooding. Model scenarios developed for this study include storms with return frequencies from 2 years to 500 years (extreme storms), durations from 6 to 72 hours, and span the four types of storms described further below. Each storm is also paired with representative boundary (tidal) conditions that include predicted Sea Level Rise (SLR) conditions for 2030 and 2070.
Ensuring Accurate Data
A variety of models were utilized to accurately calculate a storm's impact on Boston.
Due to the City of Boston’s location, it is vulnerable to several different storm types, each with different characteristics and patterns of movements. As a result, four different representative storm types were considered for this analysis, to enable a thorough examination of potential flooding impacts:
1. Airmass (summer thunderstorms) – Airmass events are single cell thunderstorms that typically occur during summer months. Airmass storms are caused by atmospheric instability and do not have any organized lifting mechanism.
2. Nor’easters – Nor’easters are low pressure systems typically located near the east coast. Strong winds, significant precipitation, and coastal flooding are all characteristic of nor’easters.
3. Frontal Storms – Frontal storms result from advancing warm or cold airmasses with a distinct boundary. Frontal storms may include intense precipitation and winds.
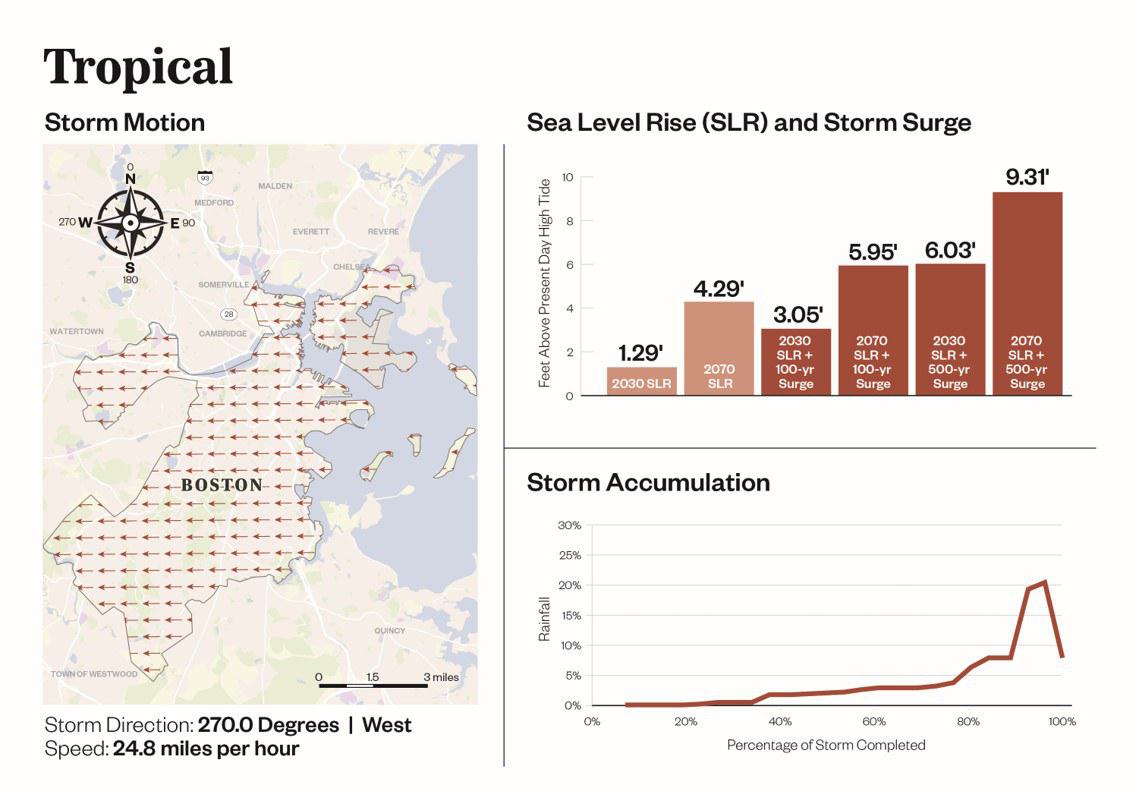
4. Tropical Storms – Tropical storms are low pressure systems that originate in the tropics and include intense rainfall, winds, and often storm surge and coastal flooding.
In order to define the parameters of each storm type (as they occur in Boston), historical rainfall data from the Nation Oceanic and Atmospheric Agency (NOAA) rain gauge at Logan International Airport (ID 19-0770) was analyzed. The analysis included hourly data from May 1948 through May 2018. Through analysis of NWS radar data of events from 1999-2018, characteristic motions for each storm classification were determined. Each storm classification is associated with a unique pattern of movement (direction and windspeed) that determines how a given storm type might move across the City of Boston. Developing this spatial understanding of each storm classification is critical for accurate simulations that reflect differences between storms.
In addition to modeling the impact of flooding throughout the collection systems (sewer and drain), the 2D model predicts the impact of coincident coastal inundation. Predictions from an existing hydrodynamic model are used to represent the impacts of storm surge, seal level rise and tidal fluctuations at the combined sewer and drainage outfalls throughout the City. MassDOT and Woods Hole Group have developed an ocean circulation model using the ADvanced CIRCulation (ADCIRC) platform, the output of which was incorporated into this study. By combining the predictions from a hydrodynamic coastal model with a fully dynamic sewer and drain model, this project attempts to better define how coastal inundation has the potential to worsen flooding further inland due to rainfall by preventing drainage through outfalls during some scenarios.
In consideration of the time it takes to run each dynamic model simulation, a battery of 6 dedicated virtual desktop interfaces (VDIs) were set up to maximize computation power using parallel computing.
Viewing the Models
Hazen developed a dynamic interface that displays the predicted flooding for different events and critical facilities impacted.

Another unique aspect of this work is the use of Microsoft Power BI and ESRI ArcGIS StoryMaps to distill complex model predictions and facilitate understanding among different audiences, including City and planning agencies and the public. Power BI serves as a database for flooding predictions and impacts on critical infrastructure. Using Power BI, a dashboard is developed for each model scenario that displays the impact of flooding on critical infrastructure. This allows for a rapid assessment of the vulnerabilities associated with each scenario (combination of storm and boundary conditions) and will support emergency planning efforts and future evaluations of adaptation and resiliency. Using ArcGIS online and the StoryMaps platform, a web-based interface is used to display results in a visually intuitive and interactive format. This allows a wide range of audiences to understand potential flooding impacts and interactively assess predicted impacts to locations or facilities that are important to each individual user. To further support intuitive understanding of predicted flooding impacts, a 360-degree photographic tour (similar to Google Street View) that includes rendered flooding impacts was developed at various locations throughout the City. This tour was developed at key locations that include widely recognizable features (such as subway stations and well-known buildings) throughout the City to help facilitate intuitive understanding of the magnitude of different flood depths.