Process Optimization and Capacity Evaluation at F. Wayne Hill WRC
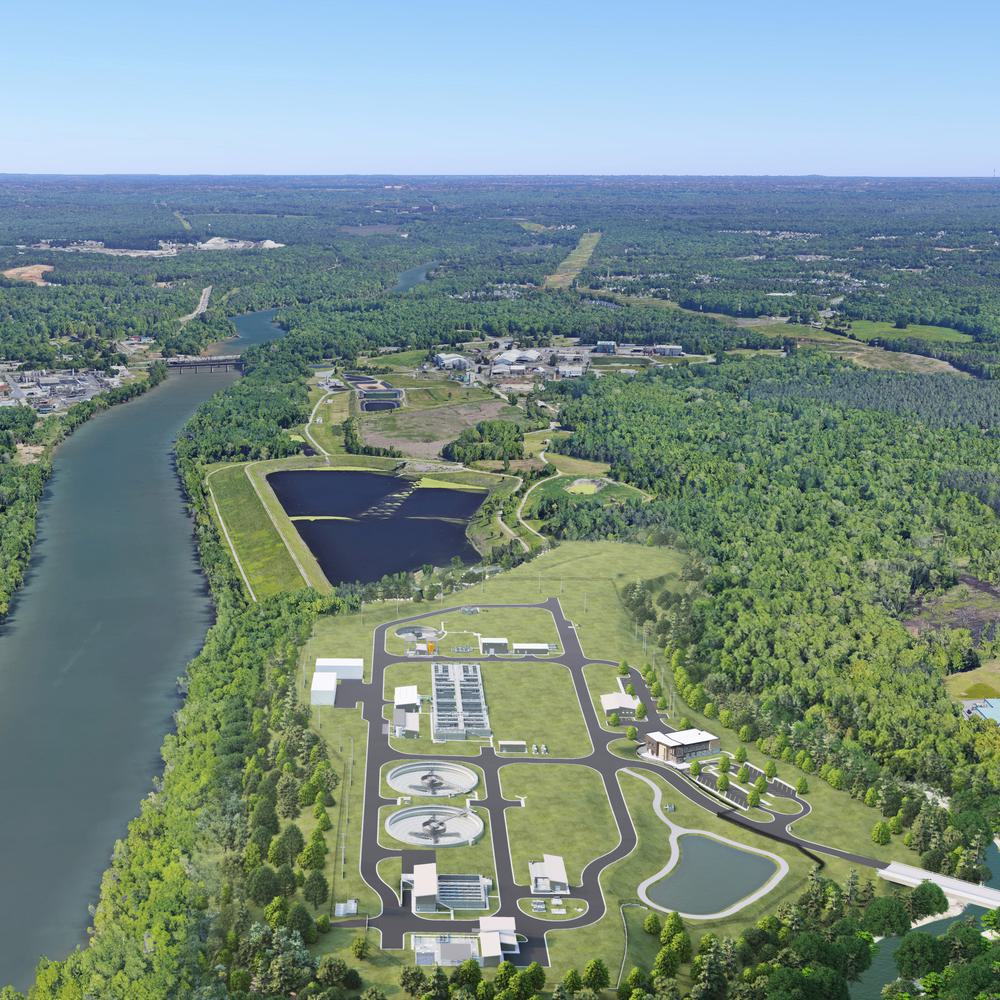
In 2008, F. Wayne Hill Water Resources Center (FWHWRC), Gwinnett County’s 60 mgd advanced wastewater plant was operating below 50% of its design flow capacity. Influent Chemical Oxygen Demand (COD) and Total Suspended Solids (TSS) concentration data had increased substantially over the past few years and primary clarifier performance had declined, resulting in a concern that the flow capacity of the plant may be significantly less than the original design annual average. Hazen and Sawyer conducted a comprehensive study to evaluate the capacity of FWHWRC. Through detailed sampling, process modeling and clarifier CFD analysis, and optimization of primary clarifier performance, the rated capacity of the plant was confirmed.
Our Work

Project Outcomes and Benefits
- The existing raw influent sample location resulted in an unrepresentative sample. The influent box was reconfigured and the sampler location moved to provide the most representative sample possible. Sampling at the revised raw influent sampling location provided a better representation of the true influent load to the plant, and was confirmed with the individual forcemain sampling and diurnal grab samples.
- Primary clarifier testing and CFD modeling indicated several issues with the performance. Baffles were installed in the primary clarifiers to improve settling. Operational changes were also made, including increasing the number of primary clarifiers online, implementing co-thickening of the WAS and primary sludge and limiting in-tank primary sludge thickening. After implementing these improvements, the primary clarifiers provided the required 50% removal.
- A BioWin model of the FWHWRC was calibrated using data collected over several months after relocation of the influent sampler, reconfiguration of the influent box, and improved performance of the primary clarifiers. Dynamic simulations using the diurnal flow and load profiles were used to evaluate the whole plant under several conditions. The outcome of this evaluation, using the dynamic BioWin modeling and a risk based approach, was that all of the liquids processes remained at the original average flow capacity of 60 mgd.