Development of an Interactive Watershed Management Plan in Gwinnett County, Georgia
Kevin Middlebrooks, Matthew Jones PhD, PE, Alysondria Eason PE, Ryan O’Banion - Hazen and Sawyer; Rachel Jones PE - Gwinnett County Department of Water Resources
Last Modified Mar 03, 2023
Introduction
Gwinnett County is a suburban community located in the Atlanta metropolitan area and is the second-most populous county in Georgia. Gwinnett County has undergone rapid growth since 1980, and land use has changed what was once predominately agriculture and forest to an abundance of residential and commercial development. GCDWR performs planning, design, and construction of watershed improvement projects to manage the effects of changing land use on County streams and meet goals established in Gwinnett's Watershed Protection Plan.
Related Solutions:
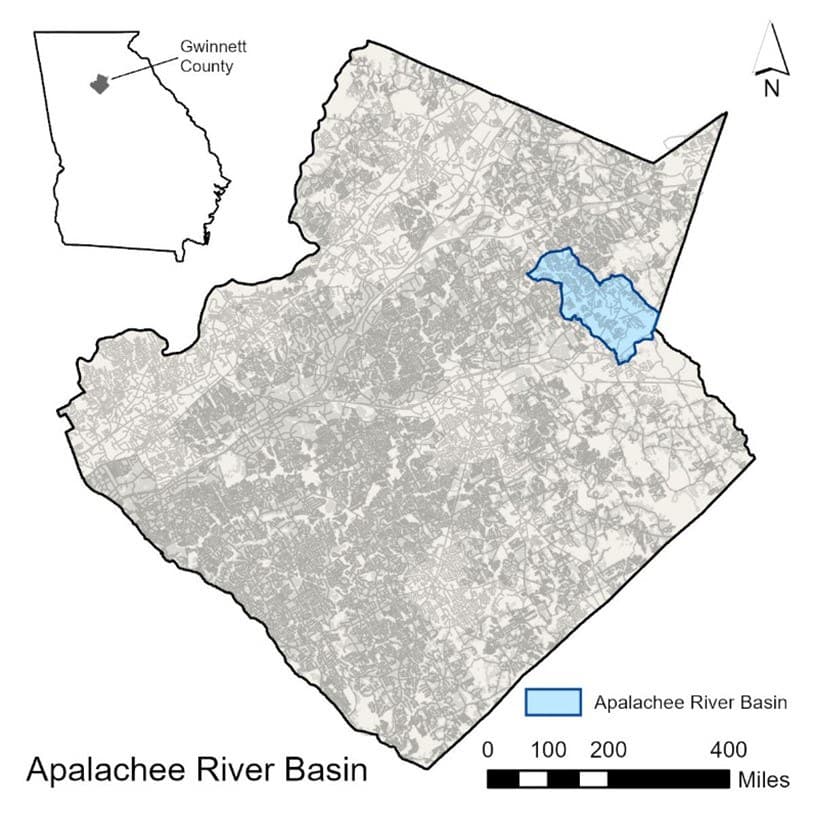
GCDWR identified an approximate 26 square kilometer watershed of the Apalachee River located in the northeast portion of the County to perform a pilot watershed characterization and BMP master planning project (Figure 1). GCDWR sought to accomplish the following goals for the project:
Develop a replicable process for characterizing watershed conditions and siting improvements. The process should be adaptable and allow DWR to re-score opportunities based on changing program priorities. Support the goals and meet the requirements of the Gwinnett County Watershed Protection Plan.
In lieu of a traditional report-style master plan, this evaluation was developed as an adaptable decision-making tool using a structured dataset and interactive dashboard visualization framework. The dashboard allows GCDWR to maintain a strong understanding of watershed conditions while at the same time tracking BMP opportunities to understand their relative importance in meeting certain objectives, prioritize watershed management activities, as well as facilitate the adaptation of the master plan to dynamic future goals and planning efforts.
Methodology
To characterize watersheds and identify BMP implementation opportunities, two separate but related phases were carried out (Figure 2).
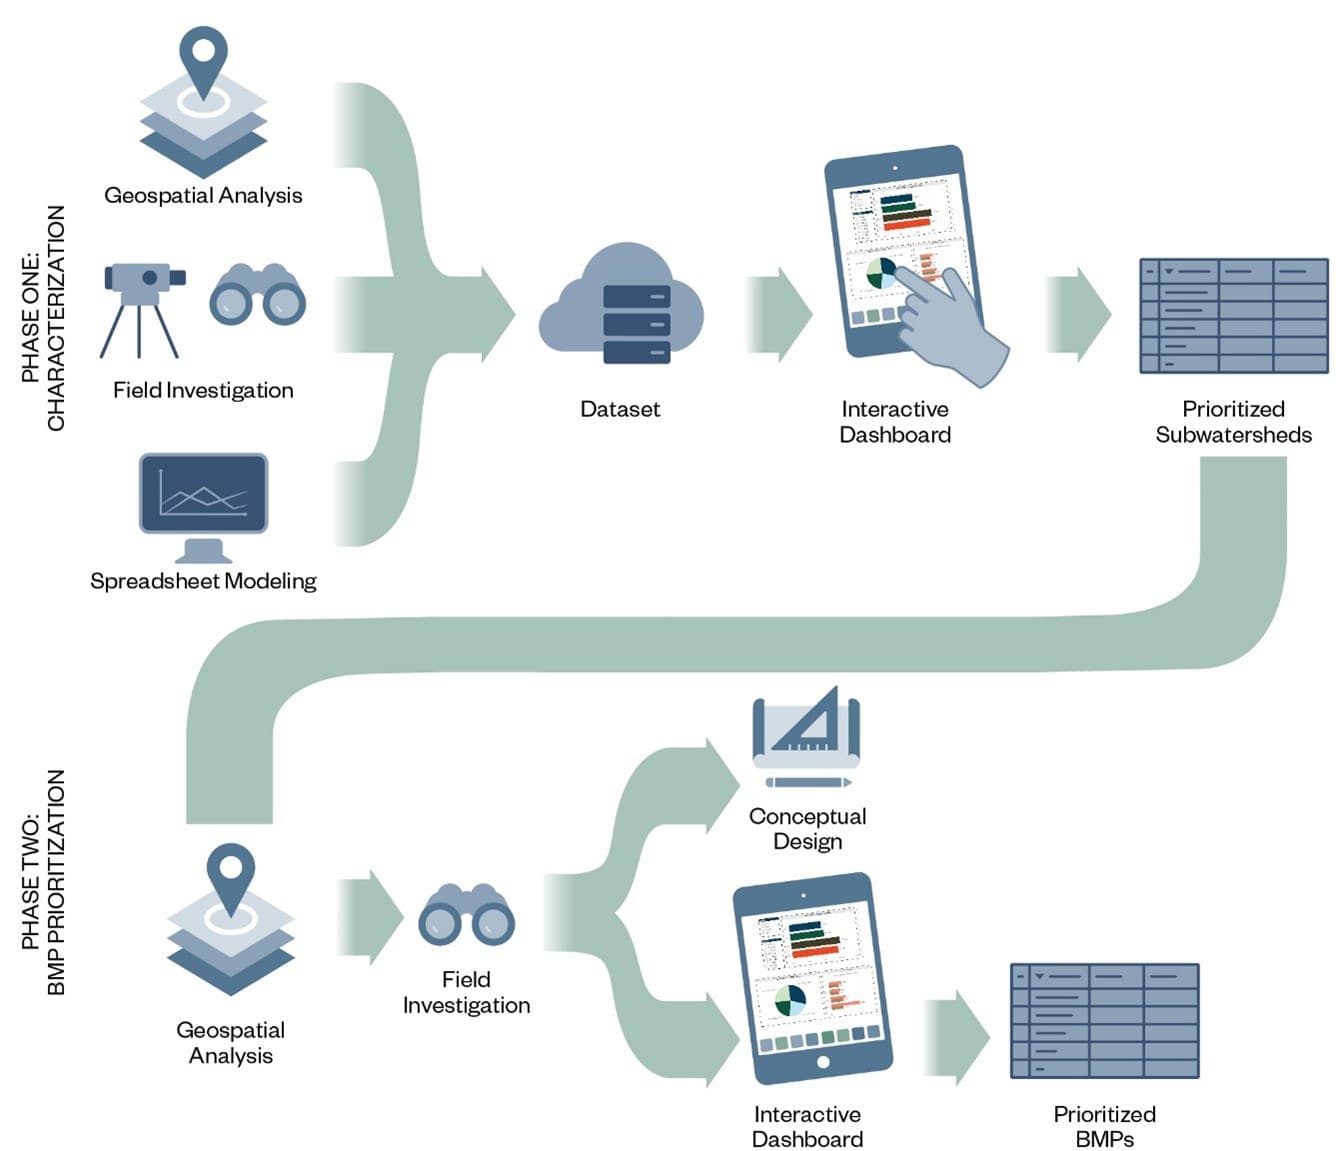
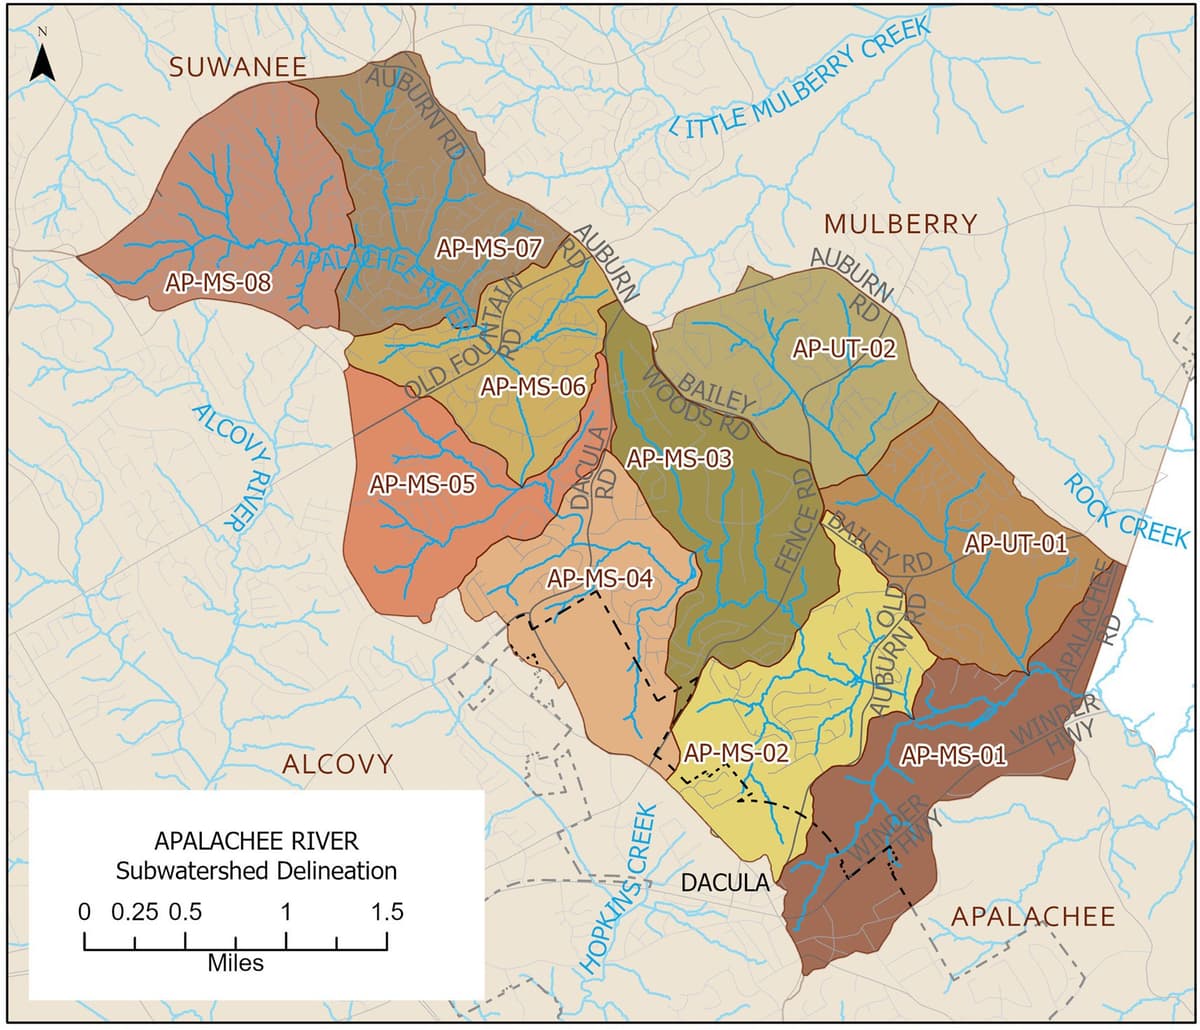
The first phase was devoted to the characterization of the watershed and subwatersheds. Subwatersheds were delineated with an approximate size of 2.6 square kilometers to allow for more precise characterization and more homogeneous subwatershed conditions (Figure 3). Then, a replicable, scalable, and rapid methodology was developed that utilized existing geospatial information combined with targeted field investigations to identify the subwatersheds most in need of restoration, as well as subwatersheds in the best condition that would benefit most from preservation.
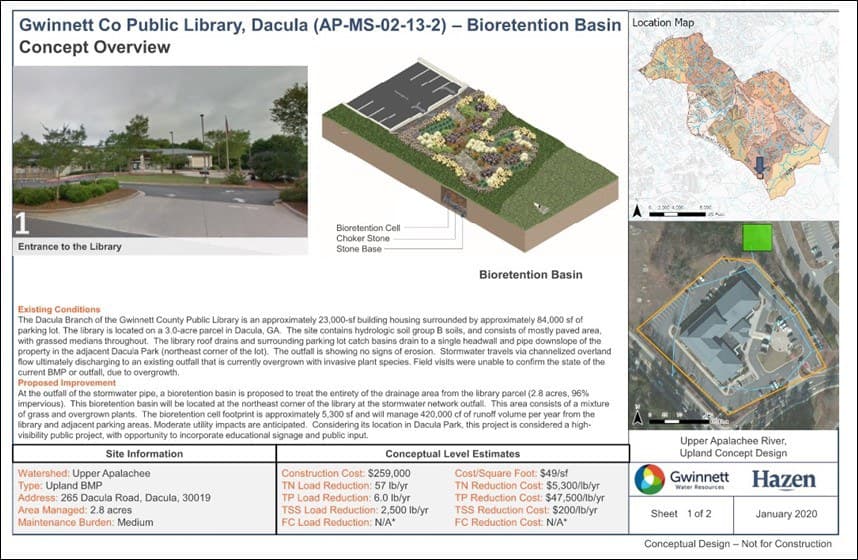
In the second project phase, a similar process was developed to identify, select, and prioritize watershed improvement activities (including structural and non-structural BMPs) across the studied watershed. The outcome of this phase provided a prioritized list of activities with accompanying concept designs for BMPs to meet the multiple objectives of the Watershed Improvement Program (Figure 4).
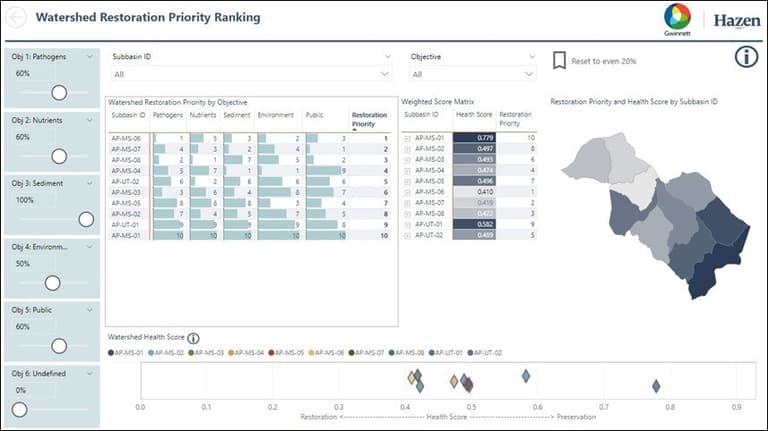
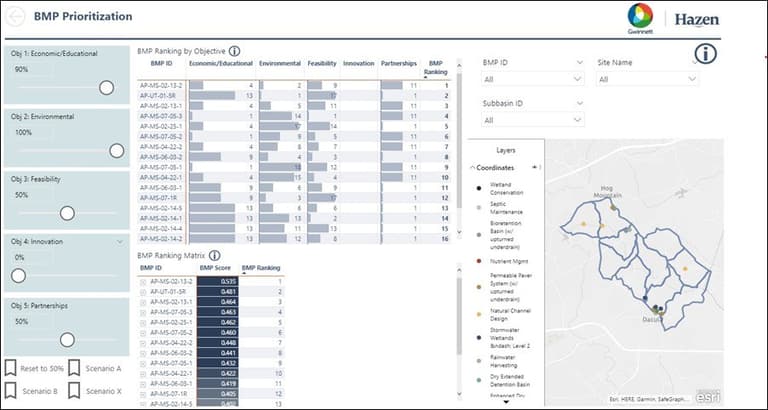
The project was undertaken with the intent of providing a dynamic approach to the watershed characterization and prioritization of identified BMPs to facilitate adaptive management as future watershed characteristics are better understood and program priorities change. To support this objective, an interactive dashboard was developed. The interactive dashboard allows GCDWR to adjust weights associated with the Watershed Protection Plan (Figure 5) and BMP Prioritization (Figure 6) objectives and immediately view prioritized results of subwatersheds for restoration and preservation and BMP opportunities.
Each of the analyses from the two phases generated a metric for factors that influence the prioritization of subwatersheds for restoration and preservation activities and selection of BMPs within the watershed study area. A hierarchical weighting process was developed that focused on possible Watershed Protection Plan objectives (pollutant load reduction, preservation of environmental assets, etc.) and BMP prioritization objectives (cost, education opportunities, economic enhancement, etc.). Each objective is associated with a series of corresponding factors and pre-determined weights. This objective-based approach enables scenario development where multiple objectives can be weighted based on their importance within the County.
Results
Based on the results of the current objectives determined by GCDWR, three subwatersheds were recommended for restoration efforts, two subwatersheds were recommended for preservation efforts, and continued monitoring was recommended for the remaining subwatersheds. As GCDWR objectives change over time, the dashboard allows for changing objective weight distributions and identification/definition of new objectives to reprioritize subwatersheds in need of preservation and restoration.
The Apalachee Watershed Characterization and BMP Prioritization analyses resulted in the following:
- Review of over 7,100 parcels in the study area
- 26 parcels field-evaluated
- 20 non-structural BMP opportunities identified throughout the watershed
- 18 structural BMP opportunities identified on 10 sites
By implementing all the proposed improvements at each of the identified sites, the County could potentially realize the following annualized water quantity/quality benefits within the Apalachee River watershed:
- 28,300 m3 of managed stormwater runoff
- 450,000 kg Total Suspended Solids (TSS) load reduction
- 2,950 kg Total Nitrogen (TN) load reduction
- 1,300 kg Total Phosphorus (TP) load reduction
- 600,000 ppb Fecal Coliform (FC) load reduction
Through continued use of this rapid watershed characterization and BMP opportunity evaluation process, the County could streamline the approach for determining prioritized areas within their designated area of service in need of restoration or conservation while selecting, siting, and prioritizing structural and nonstructural BMP opportunities to meet variable metrics. Further, this rapid process facilitates the “reshuffling” of criteria weights as program priorities change, and lessons are learned from implementation, while providing justifiable methods for project identification, selection, and potential gains, and reducing supplemental field effort and data collection beyond County-managed geospatial information.
Conclusions
Beyond guiding improvements to the Apalachee River watershed, the framework described herein can be readily scaled and adapted to manage and improve other watersheds. Because of the dynamic nature of the underlying watershed planning framework, incremental advances in both implementation and planning efforts over time can be captured to inform and support future efforts and the realization of improved water quality and healthier watersheds throughout the County.