CFD Modeling and Validation Testing of Peripheral Feed Overflow Clarifiers
Last Modified Sep 14, 2022
In 2014, EBMUD elected to develop a computational fluid dynamics (CFD) model of the PFPO secondary clarifiers to understand the existing clarifier performance, determine the existing clarifier capacity, and identify modifications to the internal structures that should be incorporated into the impending upgrades. Extensive CFD modeling has been performed on center feed peripheral overflow type secondary clarifiers. However, the literature on CFD modeling of PFPO clarifiers is very limited, and to the knowledge of the authors, similar work where a full-scale validation of the modeling results has not been conducted. This paper will present a case study where the CFD model was calibrated, used to predict performance before and after proposed modifications, and the successful implementation and validation of the actual clarifier rehabilitation.
Field Investigation
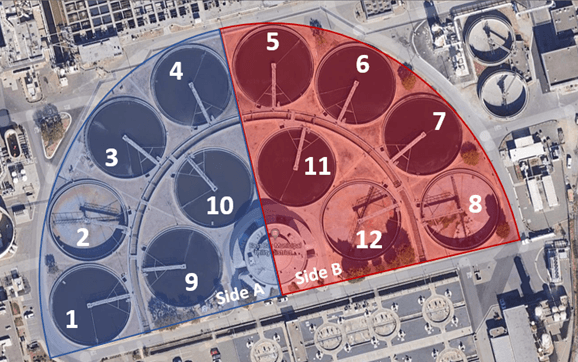
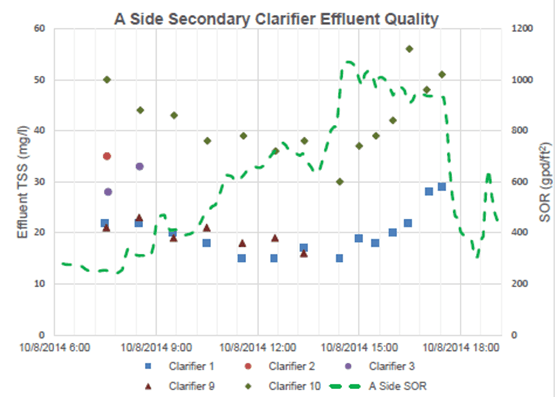
Initial field testing to support the CFD model development occurred in October 2014 and included stress testing, determining sludge settleability and flocculation kinetics, and dye studies. The clarifiers were subjected to a range of surface overflow rates (SOR) over the testing period. Effluent quality did not experience a dramatic decline despite higher flow rates during stress testing. The design peak SOR of the secondary clarifiers, assuming all units in service, is 910 gpd/ft2. SORs higher than design peak were sustained during stress testing for both the A and B sides; the average effluent total suspended solids during stressed conditions was 22 mg/L and 20 mg/L for A side and B side, respectively.
While most of the clarifiers performed well over the range of SORs, Clarifier 10 performed significantly worse than the others during baseline and stress testing, despite having an internal configuration similar to the other secondary clarifiers. Figure 2 shows the performance of Clarifier 10 compared to the other clarifiers during stress testing (difference between Clarifier 10 ESS and the others was greater than 15 mg/L). Hazen recommended verifying the accuracy of the effluent flow meter using a volumetric method as it appeared that Clarifier 10 received more flow than the other clarifiers during testing.
While Clarifier 1 showed similar effluent quality to other clarifiers during testing, this clarifier experienced a higher degree of short-circuiting and higher blankets compared to other clarifiers. This behavior is associated with a lack of target baffles; it was later confirmed that approximately 95% of its target baffles underneath the influent orifices were missing.
Modeling
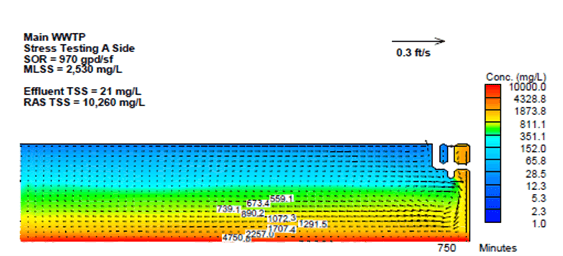
Based on field testing results Hazen developed a 2Dc model of the 12 PFPO secondary clarifiers. The CFD model validation and calibration indicated the presence of strong density currents in the clarifiers as noted in field observations. The existing skirt baffle is too short to control the density currents within the clarifier. CFD model analysis indicated that the optimal skirt baffle length is 30-inches below the bottom of the effluent trough.
The model was also used to perform a capacity analysis; it indicated that the performance of the secondary clarifiers is dependent upon sludge settle ability and mixed liquor suspended solids (MLSS) concentration. With the existing secondary clarifier configuration, only 2 secondary clarifiers can be out of service during a peak flow event (for the historical MLSS of 2,120 mg/l and the historical SVI of 110 mL/g). Modifying the internal configuration of the secondary clarifiers will allow more operational flexibility during peak flow events. The modeling results indicate that the proposed modification, discussed in the next section, would result in improvements of 25% in effluent quality.
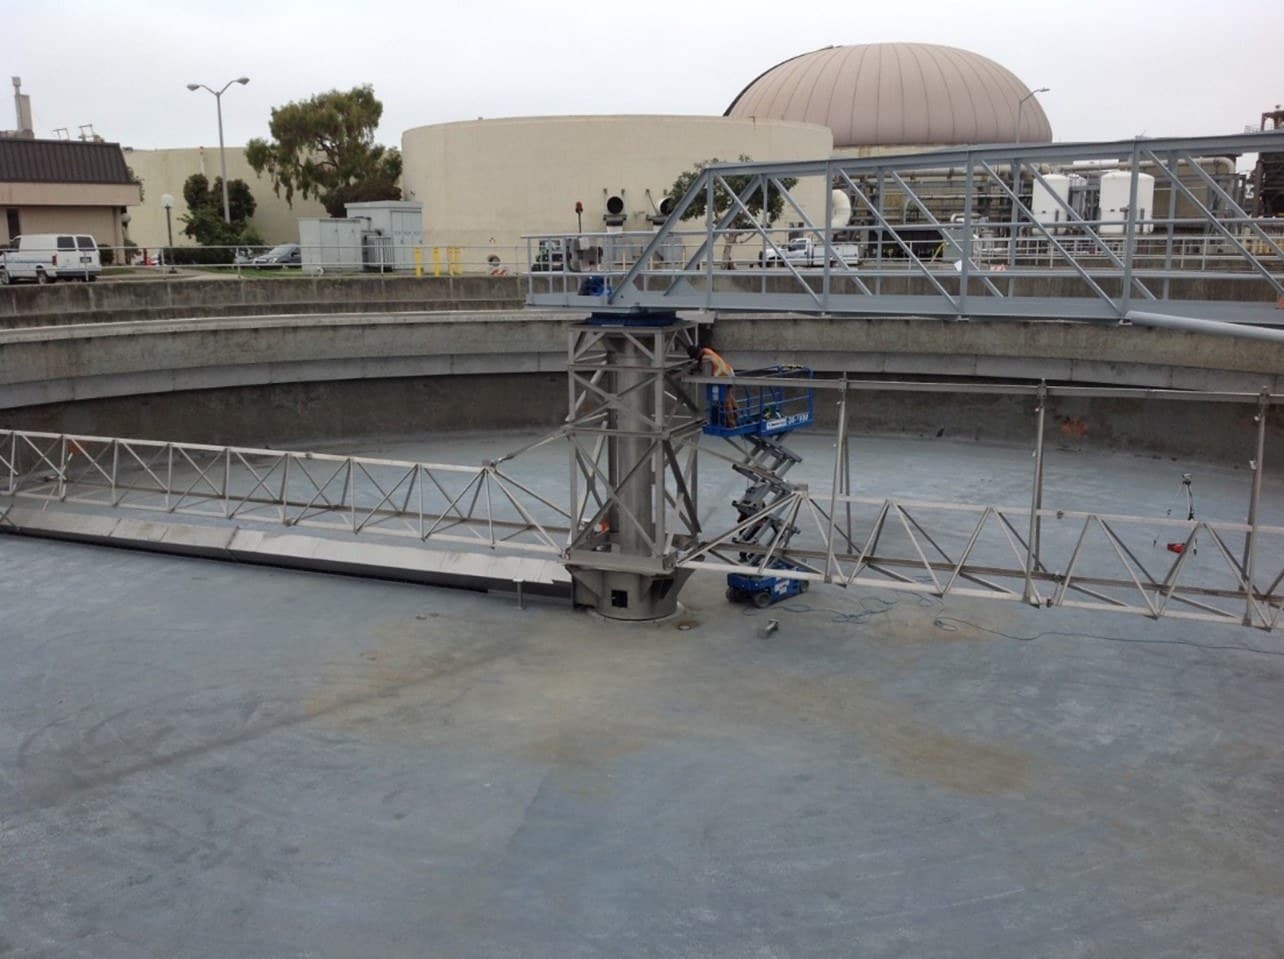
Modifications
In 2017 EBMUD designed and implemented modifications to Clarifiers 1 and 10 based on field testing observations and CFD analysis of the existing clarifiers. Subsequent to the modifications, EBMUD noted qualitative improvement in the modified clarifiers.
In addition to the internal modifications, EBMUD began replacement of the individual clarifier effluent flow meters that are used to control the MLSS influent to the clarifiers. The new flow meters are factory calibrated whereas the original flow meters’ calibration was often suspect.
Validation Testing Results
In 2019, EBMUD chose to perform validation testing on the two modified clarifiers to quantify the performance improvements. This testing provided an opportunity to verify improvements and identify if the recommended design should be adjusted before upgrading the remaining ten unmodified clarifiers.
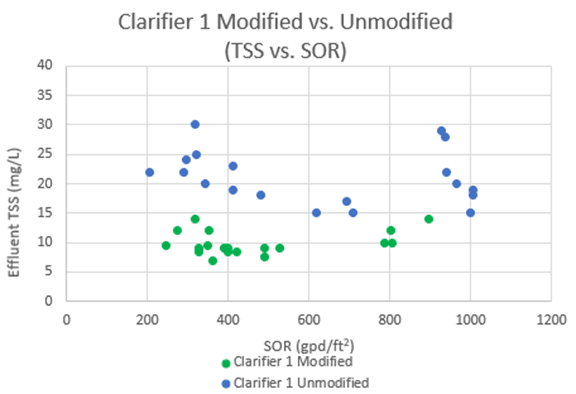
Validation testing was conducted in October 2019 and focused on side A where the modified clarifiers are located. Both modified clarifiers showed improvement over their previous performance in 2014. Modified Clarifier 1 showed an ~50% improvement in effluent quality over the unmodified Clarifier 1.
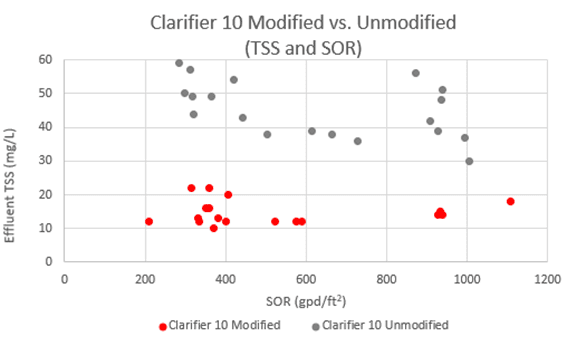
Prior to construction, the unmodified Clarifier 10 averaged 46 mg/L at high flows while modified Clarifier 10 averaged 15 mg/L. This represents a 65% improvement in effluent quality.
The testing shows that over a range of SORs, the modified Clarifier 1 performed significantly better than the unmodified Clarifier 1. Over baseline conditions Clarifier 1 effluent TSS improved from 24 mg/L to 10 mg/L. Over stress testing conditions effluent TSS improved from 22 mg/L to 11 mg/L. Modeling suggested that the recommended upgrades to the clarifiers would improve effluent quality by 25% but validation testing showed an improvement of ~30% (when comparing all clarifiers).
While Clarifier 1 showed significant improvement over the unmodified clarifiers, Clarifier 10 improved from performing substantially worse to performing on par with the unmodified clarifiers during current testing. Considering the original performance of Clarifier 10, this is a significant improvement. Over baseline conditions Clarifier 10 effluent TSS improved from 52 mg/L to 17 mg/L. Over stress testing conditions effluent TSS improved from 46 mg/L to 15 mg/L. This represents an improvement in effluent quality of approximately 65%.
Conclusions
While there is minimal literature on CFD modeling of PFPO clarifiers, the study suggests that it can be done with great success. The original modeling resulted in recommended modifications to the existing clarifiers and predicted improvements of 25% in effluent quality. Validation testing after two clarifiers were modified proved the modifications were valuable and confirmed the original modeling results; the average improvement in effluent quality was observed to be 30%. The study shows that CFD modeling of PFPO clarifiers can successfully predict effluent TSS performance for improvements made to the clarifiers before they are made.