Improving Wastewater Operations at HRSD
Hazen helped Hampton Roads Sanitation District employ new technologies to create a data-driven approach to operations
In southeastern Virginia, Hampton Roads Sanitation District (HRSD) handles wastewater treatment for 1.7 million people in 20 cities and counties. Sea-level rise, unusually high tides, and extreme storms prompted a $1.2 billion program—the Sustainable Water Initiative for Tomorrow (SWIFT) that involves replenishing the Potomac aquifer with up to 100 million gallons of SWIFT Water™ (water treated to meet drinking water standards and matched to the existing groundwater chemistry in the aquifer) per day, an action that may slow or reduce the impact of sea level rise by slowing land settling, or subsidence.
Related Solutions:
While developing Hampton Roads Sanitation District’s (HRSD) digital strategy for the District’s asset portfolio lifecycle, Hazen also created a framework for integrating asset management and O&M information with GIS and CMMS for the SWIFT Research Center.
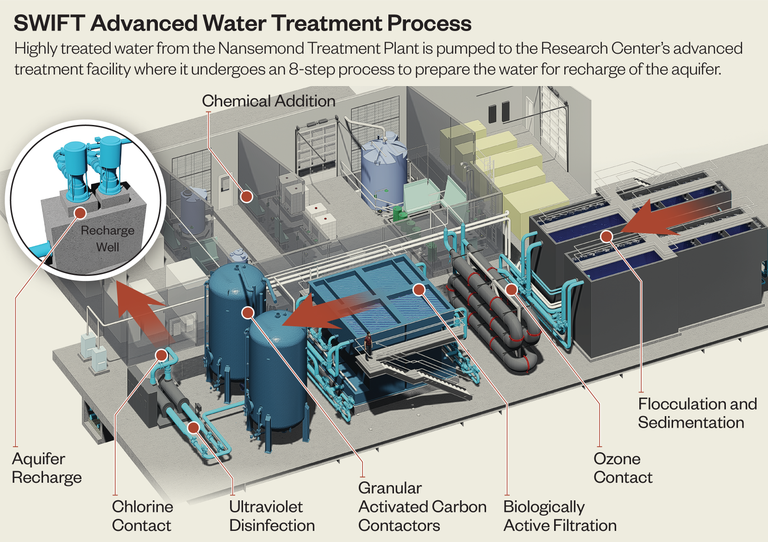
The SWIFT solution incorporates an 8-step process to prepare water for recharging the Potomac Aquifer, preventing subsidence and increasing resiliency to sea-level rise.
The SWIFT solution will recharge the overdrawn Potomac aquifer with water treated to meet drinking water standards and matching existing groundwater chemistry. The work will renew a resource that has been greatly depleted over the past 100 years, arresting subsidence, adding resiliency to handle stormwater events, and combating the growing issue of saltwater contamination.
SWIFT and other innovative approaches are indicative of HRSD’s leadership. Well established in the area, HRSD has provided regional wastewater processing capacity since 1940. It operates 17 wastewater treatment plants collecting from pipes and pump stations run by local governments near the mouth of the Chesapeake Bay—and their work scope is growing due to environmental and economic pressures.
Augmented reality allows for a person to receive enhanced details about a location or piece of equipment in real time. Augmented reality has many applications including spatial orientation and tagging of key assets in a facility, collaboration and troubleshooting of equipment or process operations with remote teams, operator or technician training, compliance verification, and even real-time viewing of process performance data.
Introducing a Digital Twin
As a cutting-edge climate action project, SWIFT provided the impetus for HRSD to employ new technologies, working with engineering firm Hazen and Sawyer.
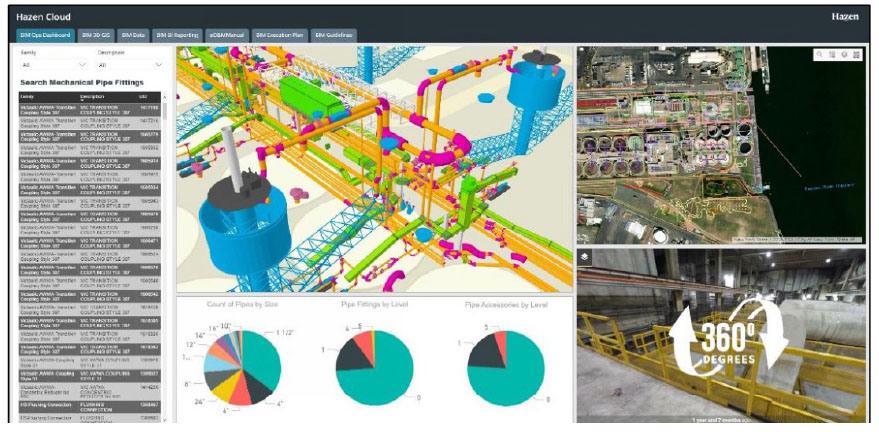
First, they combined building information modeling (BIM) designs with geographic information system (GIS) maps, workflows, and analysis. Together BIM and GIS data helped the district establish a feature-rich model, known as a digital twin, of the SWIFT Research Center that provides the proof of concept for the program. Over the next 10 years, HRSD will build at least four more facilities to resupply the aquifer with up to 100 million gallons of water per day.
Now, planners can explore the design models via virtual and augmented reality wearing goggles that immerse them in the infrastructure. Operational staff and construction crews can see where a new pump or asset will be located, for instance, and ensure it gets placed in the correct location. Facility owners can assess the maintainability and operations of assets prior to construction. And the models provide an ideal training platform for new staff.
Sensing and Examining Changes
To help ensure water quality, HRSD crews test private and commercial irrigation wells near where treated water recharges the aquifer. They use sensors to measure shifts in water quality, syncing sensor data on a GIS map where it can easily be monitored.
The district takes a similar, sensor-driven approach to monitoring pressure and pump performance for its 651 miles of pipes and 131 pump stations. Staff keep an eye on their GIS interface to examine assets at every location. The data feeds an operational PI dashboard with a map, sensor readings, and graphs to track variables such as salinity.
Modern GIS for Operational Intelligence
For more than 12 years, the district has relied on GIS as a critical tool for day-to-day operations. In addition to smart maps and dashboards, GIS provides analytics to help HRSD meet growing infrastructure needs.
HRSD started its use of GIS for operations, interfacing with its computerized maintenance management system (CMMS) and for managing customer information. GIS is used to know the age, condition, and performance of the asset as well as understanding risk, hydraulic capacity, and processes.
The shift in approach from siloed data collection includes embracing data-centric and model-centric workflows that integrate GIS, BIM, and as-built information with tools like Microsoft’s Power BI, Tableau, and other readily available data analysis tools.
Offering Operational Insights
By combining Esri’s geographic information system (GIS) technology and Autodesk’s building information modeling (BIM) software, Hazen and Sawyer has been able to integrate design data for clients through the whole lifecycle of a project while preserving the geographic context of all assets. This approach has helped increase the efficiency of project delivery by elevating information important to a variety of end-users, while also making more detailed data readily available when it is required.
The benefits of this design approach are already evident at many facilities. Hazen has more recently been successful at extending a data-driven approach to operations. A comprehensive digital representation of a facility—often called a digital twin—enables the utility to perform simulations and scenario testing to identify potential performance improvements.
“Huge capital programs produce so much valuable data that had traditionally been siloed and available only to those with both the time and expertise to dig it out,” said Jamie MacDonald, Digital Solutions Lead at Hazen and Sawyer. “Now we can work backwards from the optimal user experience, building dashboards that integrate BIM, GIS, and other data sources to elevate information that is actionable for each utility user.”
The shift in approach includes embracing data-centric and model-centric workflows that integrate GIS, BIM, and as-built information with tools like Microsoft’s Power BI, Tableau, and other readily available data analysis tools. Hazen has added data scientists to its team, who write scripts and build analytical routines to improve information exchange between different user groups during design, construction, and operations.
The Hazen team helps clients meet maintenance goals by managing vertical and linear assets using BIM and GIS.
“The integration of data enables a new kind of operational intelligence,” MacDonald said. “The more data-driven decision-making you’re using, the more optimized a utility’s capital and maintenance plans can be.”
Excerpted from ESRI's blog