Performance Reporting & Decision Making Through Effective Data Integration and Management
Simple data analytics reveal basic insights; more sophisticated analytics, applied to data that has been pooled into a data “lake” with data from external and enterprise sources allows utilities to unearth deeper insights that will help to optimize performance. Because of the growing volume, complexity and strategic importance of asset management data, it is no longer desirable or even feasible for each department/ unit/division/function within a utility to manage this data by itself, or to build its own data analytics capabilities.
Related Solutions:
Our Work
To get the most out of the new data resources, utilities are creating dedicated data groups that are potentially embedded within the core asset management program team to consolidate data collection, aggregation, and analytics.
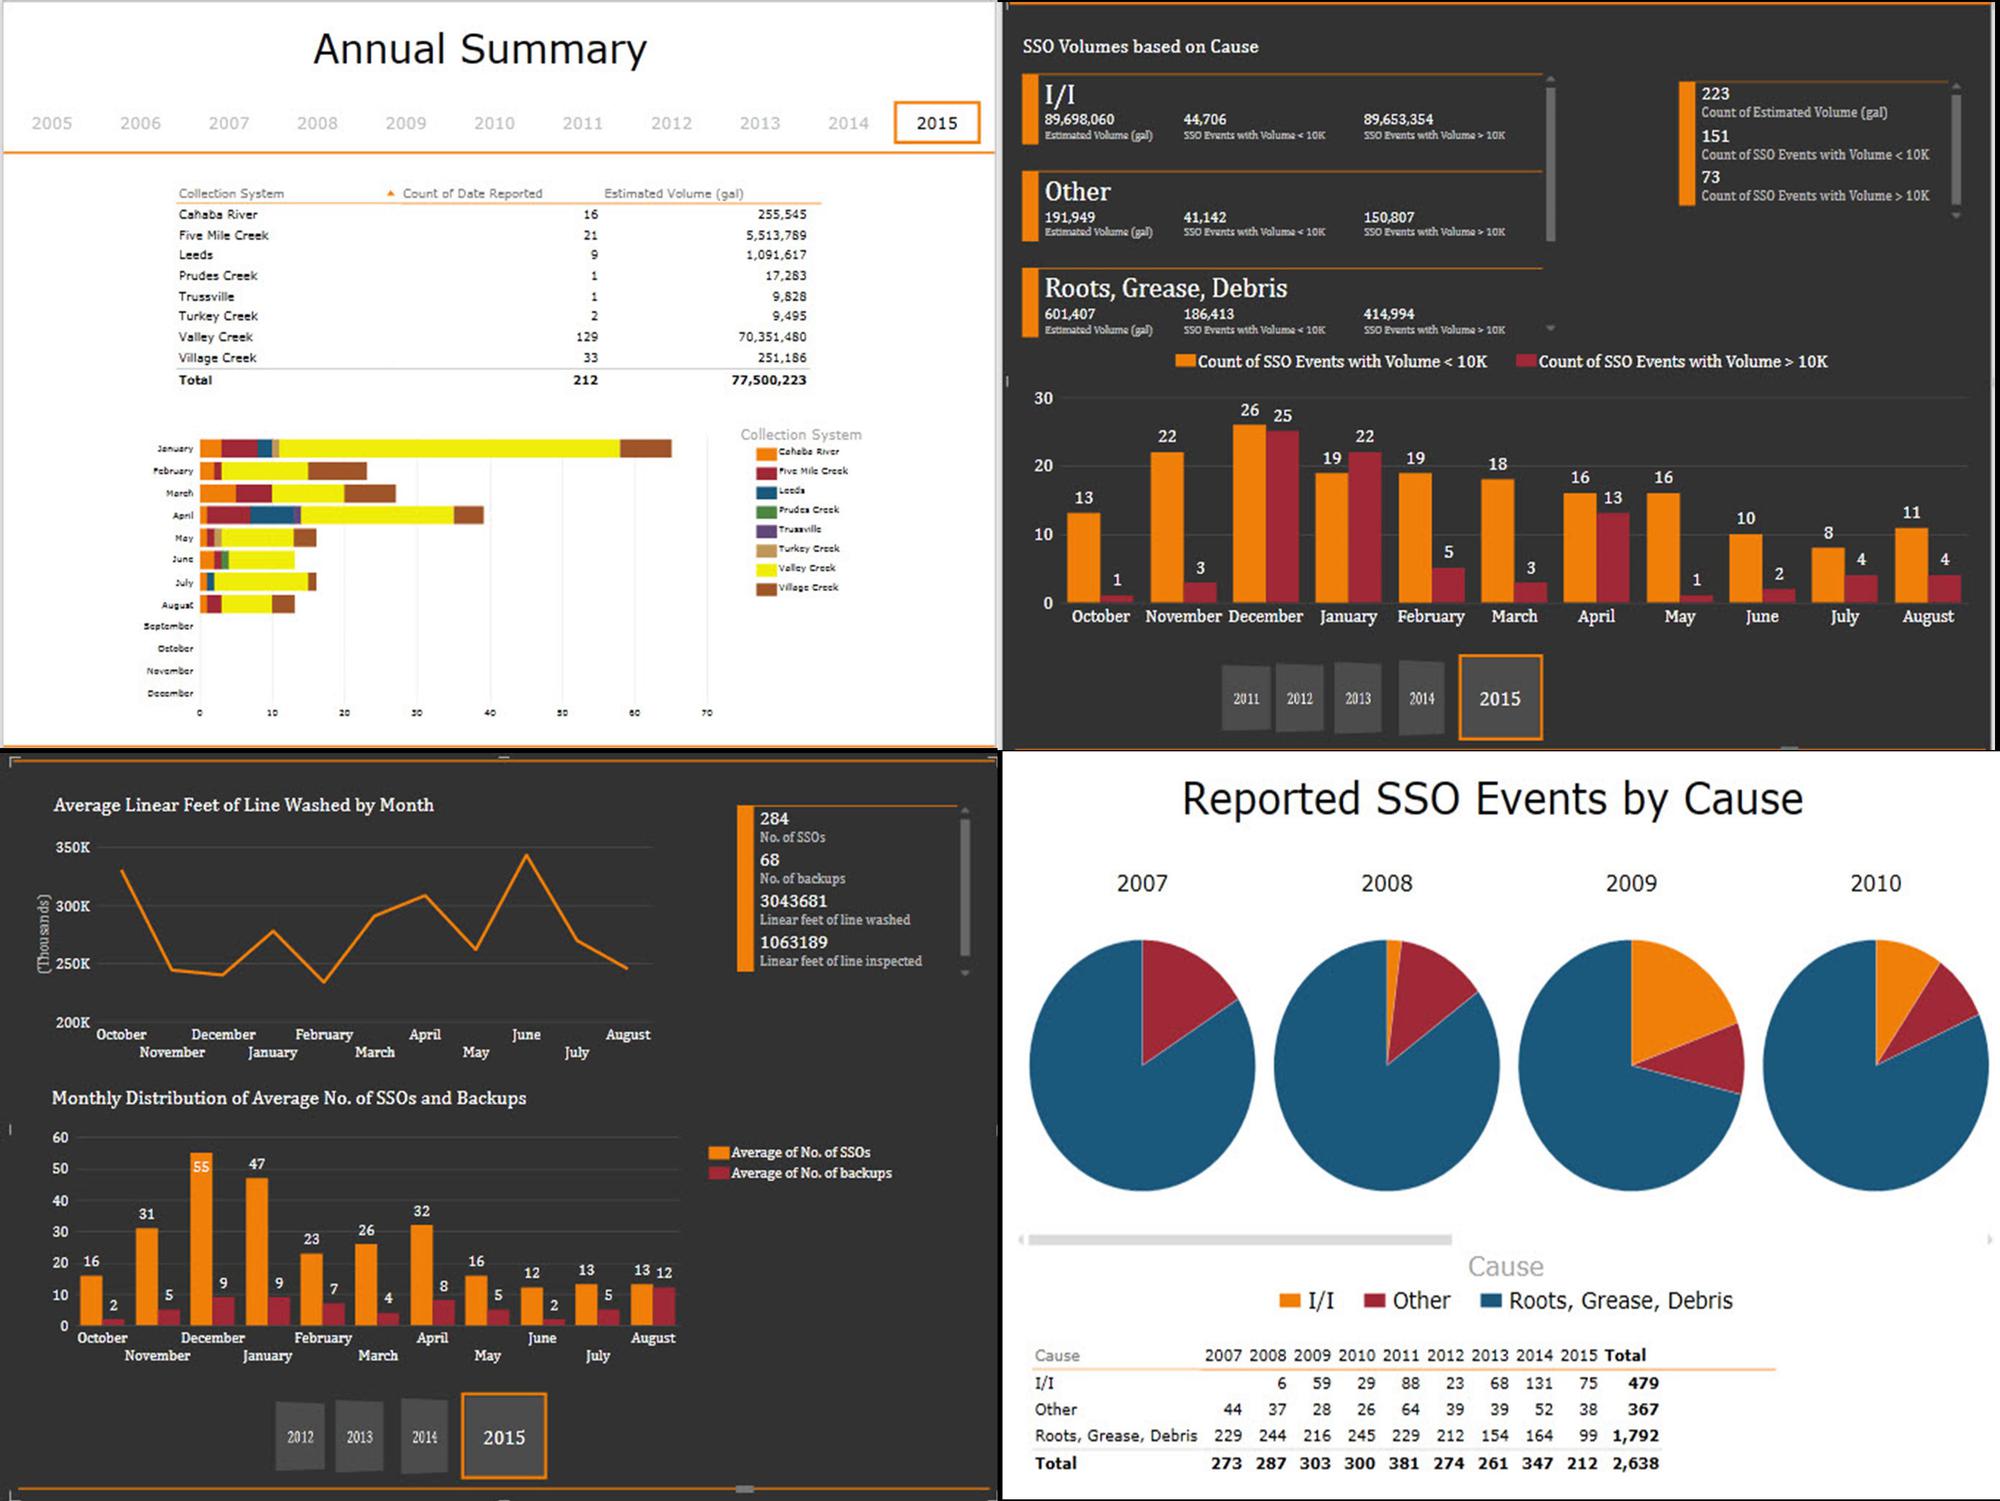
Recently, advances in technology have revolutionized data and performance reporting so that users (with limited IT development expertise) can perform data mining and develop high impact visuals for performance reporting. Water utilities are implementing Business Intelligence (BI) frameworks to track and report key asset management performance indicators and other data analytics.
Benefits of one such performance reporting framework include:
- Eliminates the reliance on core IT developers to develop and manage reporting frameworks as BI is now integrated with common applications, putting the non-IT user in a position to perform complex data analysis and develop aesthetically-pleasing and meaningful visualizations
- Significantly reduces development cost and level of effort
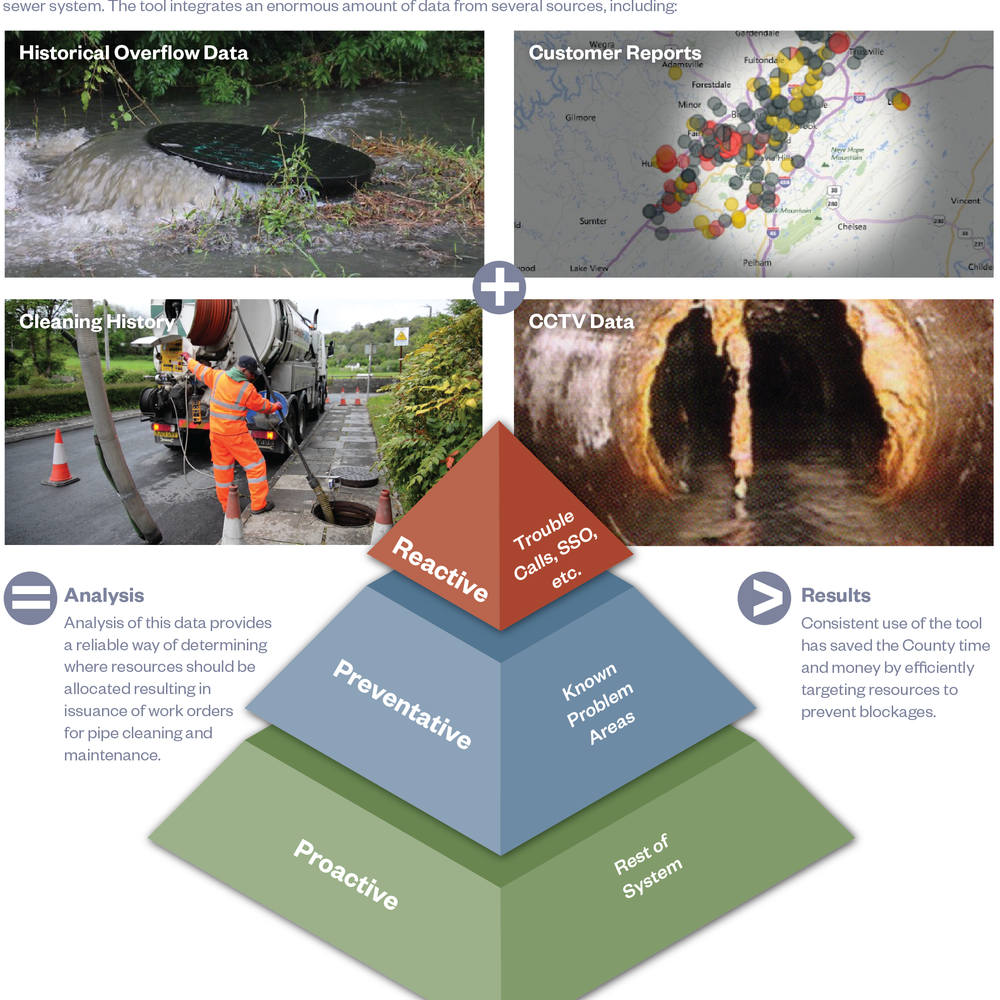
- Through the concept of data “lakes”, data models can be constructed using data from various sources (CMMS, GIS, SCADA, project management, financial and customer information systems) with relative ease
- Eliminates the extensive costs and need for complex and disparate system integration that is typically required to connect data for effective performance reporting
- Reduces the time to develop high impact visualizations to hours or days, rather than weeks, months, and years
- Complete transferability to mobile devices for effective and seamless collaboration and use at internal meetings and workshops
This presentation will discuss the asset management performance reporting frameworks that have been implemented by utilities for effective integration, tracking and reporting of various data within their asset management and other programs.
The primary focus of this presentation is to demonstrate the underlying process of data compilation, integration and reporting. This business process will also demonstrate how continuous improvement is embedded in the process leading to improved data collection and management strategies over time. Two case studies (water utilities) of actual dashboards with data analytics and associated business processes will be reviewed as part of this presentation.