Novel Application of Clarifier CFD Modeling to Increase Trickling Filter/Activated Sludge Capacity
Will Martin, Alonso Griborio, Victoria Boschmans, Paul Pitt - Hazen and Sawyer; Jue Zhao, Steve Celeste - City of Salem
Last Modified Sep 14, 2022
Background
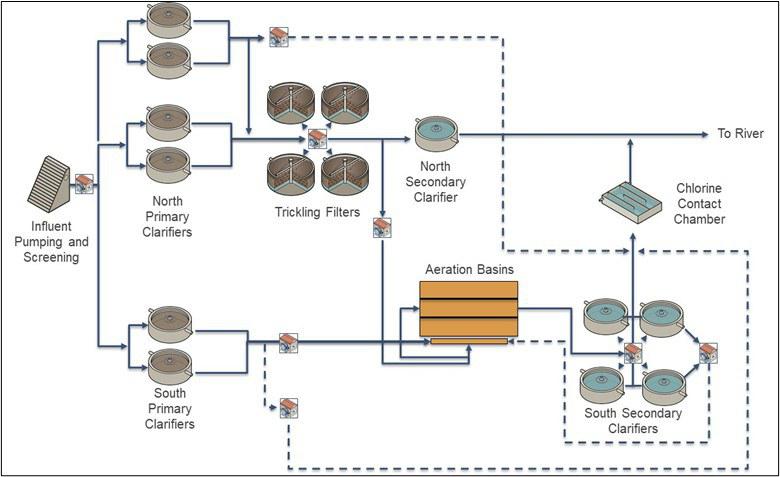
The City of Salem is the owner-operator of the Willow Lake Water Pollution Control Facility (WLWPCF), which has a permitted capacity of 35-mgd average dry and 155-mgd design peak wet weather flow. The North Plant, constructed in 1964, consists of four primary clarifiers, four trickling filters (TF) and one secondary clarifier (North Secondary Clarifier - NSC). The South Plant, constructed in 1976, consists of two primary clarifiers, aeration basins, and four South Secondary Clarifiers (SSCs). Figure 1 presents the WLWPCF process flow diagram.
Related Solutions:
The WLWPCF receives influent from a sanitary collection system with a high peaking factor. Management of wet weather flows through the WLWPCF is a significant challenge for plant staff, and they have developed strategies to optimize capacity and performance of the plant during wet weather events. Operational strategies include the following:
- Flow < 45 mgd: primary effluent (PE) is treated in the TF first followed by aeration tanks.
- Flow >45 mgd but < 105 mgd: PE is split between the TF and activated sludge (AS) process.
- Flow > 105 mgd: PE is split between the TF and AS process with flows greater going directly to disinfection.
The use of the two sets of clarifiers are significantly different. The SSCs are used continuously for settling aeration tank effluent, while the NSC is only used periodically during wet weather events to treat TF effluent flows. As such, the performance and challenges associated with each set of clarifiers are significantly different.
Objective
The City of Salem budgeted for rehabilitation of the NSC and SSCs in their current CIP due to ageing mechanical equipment. The City desired to understand effective capacity limitations associated with their clarifiers and evaluate whether clarifier modifications could be made to expand available capacity. To accomplish this goal, clarifier computational fluid dynamic (CFD) models were developed and calibrated for the NSC and SSCs.
The application of CFD modeling for capacity analysis and optimization of primary and secondary clarifiers is well documented in literature. However, most of these applications were conducted for AS plants with very few case studies applied to other suspensions such as TF effluent. To the knowledge of the authors, a similar case study to the one presented here for the evaluation and optimization of TF clarifiers has not been presented before. TF effluent has very different characteristics compared to conventional AS and typical raw wastewater. This paper presents a detailed study of TF effluent settling and flocculation properties and the application of customized clarifier CFD modeling.
Approach
To determine the effectiveness of design modifications in improving secondary clarifier performance, Hazen conducted clarifier stress testing and developed calibrated CFD models for the NSC and SSCs. The 2Dc model was used for the clarifier evaluations (Griborio and McCorquodale, 2005). CFD model calibration was based on an extensive clarifier testing protocol to simulate peak clarifier loadings, characterize sludge settleability and flocculation properties, and evaluate performance. This work included clarifier stress, sludge zone settling, flocculation and dispersed solids testing.
After development and calibration of the CFD models, each set of clarifiers were evaluated to determine the available capacity with the current geometry and mechanism type, potential optimization strategies (addition of energy dissipating inlet wells, modifications to the flocculation well sizing, and addition of baffling), and potential enhanced capacity with optimization strategies incorporated. The results of these simulations were used by the City to tailor capital planning for future clarifier rehab and mechanism replacement projects and re-evaluate wet weather capacity and operating strategies at the WLWPCF.
Field Testing Results
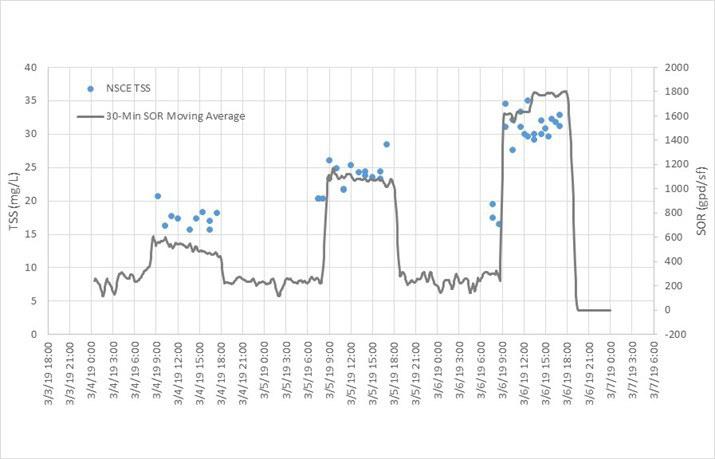
Multiple days of testing were dedicated to each set of clarifiers at WLWPCF. During NSC testing, loadings up to approximately 1,700 gpd/sf were applied to the NSC to simulate peak flow conditions. As shown in Figure 2, the NSC effluent total suspended solids (ESS) increased as loadings were increased to the clarifier. In addition, settling and flocculation properties of the TF effluent were characterized during the field testing. Among the key findings from the characterization testing were the following:
- The NSC exhibited high concentrations of dispersed suspended solids (see Figure 3), indicating that the TF effluent had a relatively high degree of small, difficult to settle particles that may impact effluent quality.
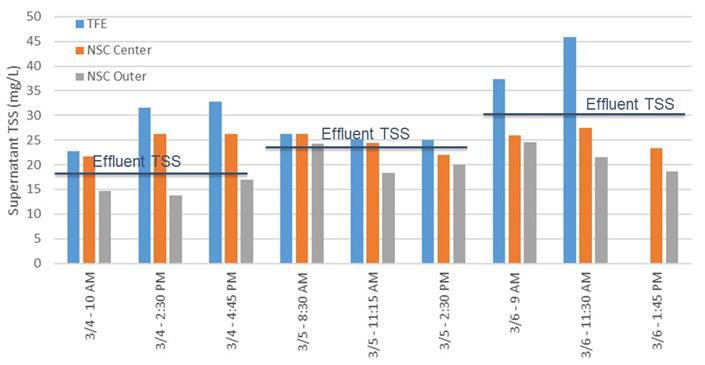
- Flocculation testing indicated that additional flocculation could help to lower effluent TSS.
- TF effluent suspended solids concentrations were typically very low during testing, and averaged approximately 40-50 mg/L. Settled, concentrated solids from the NSC were collected and tested to mimic sludge volume index measurements and had an average value of 58 mL/g.
- Vesilind settling parameters observed from zone settling column testing were typical for the values expected from a suspended growth AS process with similar SVI values.
Field testing was conducted on the SSCs under a period of high SVI. Loadings up to approximately 1,200 gpd/sf were applied to the SSC to simulate peak flow conditions. The SSCs generally performed well during field testing and were able to maintain performance at loadings up to approximately 1,000 gpd/sf, but experienced near failure conditions due to elevated sludge blanket height at loadings of approximately 1,200 gpd/sf. The sludge settling and flocculation properties were observed to be typical of AS with SVI’s of approximately 265 mL/g, which was the average measured during testing.
CFD Modeling Results
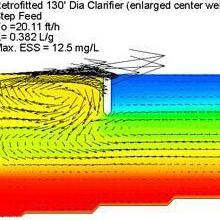
Both NSC and SSC CFD models were calibrated and validated to the field data. For the NSC, the calibrated model was used to evaluate the impact of clarifier modifications and evaluate available capacity as shown in Figure 4. The following conclusions were drawn from the modeling results:
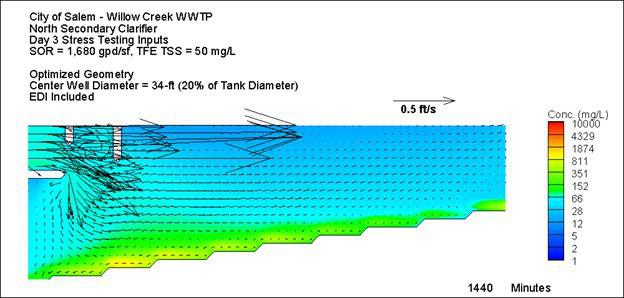
- The NSC performance could be expected to improve significantly with retrofits that include a larger flocculating inlet well diameter and an energy dissipating inlet. The expected performance improvement to effluent TSS under current peak flow conditions could be as much as a 20% reduction.
- Not accounting for existing hydraulic limitations, the CFD modeling indicated that the effective capacity of the modified NSC could be expanded from approximately 40 mgd to more than 45 mgd without jeopardizing effluent permit limits.
For the SSCs, the calibrated model was used to evaluate the impact of clarifier modifications and evaluate available capacity. The following conclusions were drawn from the modeling results:
- The SSC performance could be expected to improve with several potential modifications including a slightly larger and deeper flocculating inlet well, addition of an energy dissipating inlet well, modification to the existing density current baffle size and configuration, and conversion to a new mechanism type.
- Not accounting for existing hydraulic limitations, the CFD modeling indicated that the effective capacity of the modified SSCs could be expanded from approximately 65 mgd to more than 90 mgd.
Summary
This paper presents a detailed study of settling and flocculation properties of TF effluent and the application of secondary clarifier CFD modeling. The primary objective of this evaluation was to determine potential clarifier modifications that would result in improved clarifier performance (lower effluent TSS and sludge blanket heights) and capacity enhancements. The historical data analysis and field testing enabled Hazen to develop a calibrated CFD model with MLSS and TFE TSS concentrations and flow rates realistic at the WLWPCF. Based on the CFD modeling evaluation, improvements were identified to potentially expand the combined clarifier peak flow capacity from approximately 105 mgd to more than 140 mgd.