So Much Data, So Little Information
Advances in Wastewater Data Analytics and Visualization
Over the last two decades, computer technology has become ubiquitous in our world and the tools we use. In the water and wastewater industry, this has resulted in a massive increase in the amount of data that can be gathered from both the equipment we use and characteristics of our physical processes. However, without an effective means of processing and visualizing our data, these significant improvements in technology represent untapped potential at best, and additional headaches for maintenance and operations staff at worst.
More recently, the push in technological advancements has shifted towards extracting useful information from our rapidly increasing banks of data. This branch of engineering, termed “data science” or “data analytics”, is one of the fastest growing fields of research and applied statistics across all industries. The overarching goal of data science is to help practitioners come to business-focused insights on data more quickly and accurately. Some of these tools use advanced data visualizations to display information in focused, logical formats that trigger critical-thinking and problem solving. Other tools utilize advanced statistics to identify relationships that could not be drawn by humans through simple data inspection.
As wastewater managers, engineers, and operators, the ability to quickly and intelligently sift through data to garner actionable information is paramount to our effectiveness. In most cases, our data abilities are not hampered by the accessibility of our data, but by our ability to understand its origins, strengths, and limitations. In many cases, data is not closely inspected until problems or operational issues arise, but this approach can lead to sloppy analyses and improper conclusions. For data to be used to its full potential, wastewater facilities must regularly assess data quality, plausibility, and trends during normal operations.
Related Solutions:
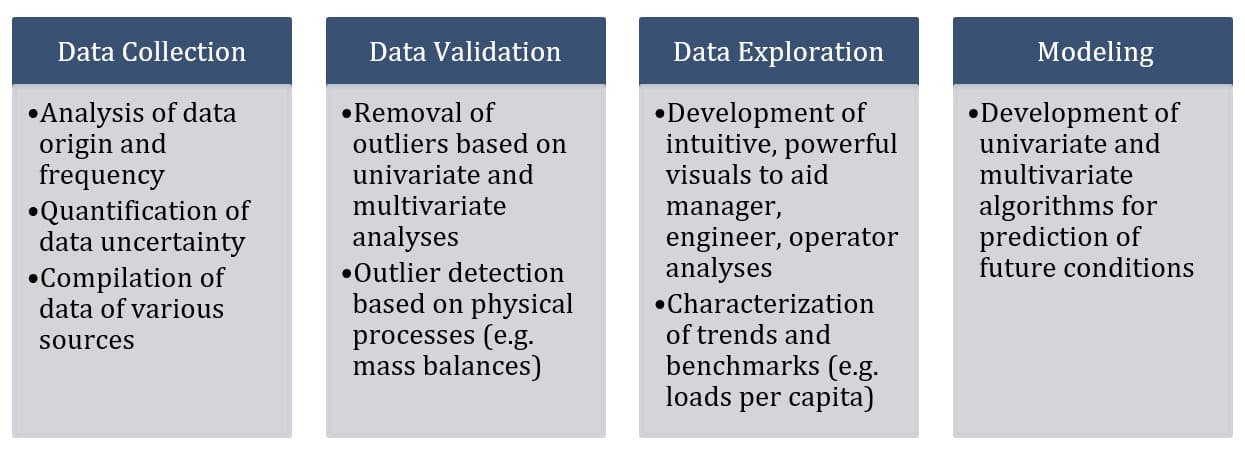
Figure 1 illustrates the typical steps in a successful data analysis and mining effort from data collection through advanced modeling. It is essential that a logical and methodical approach is used for data mining tasks to ensure that predictive models and conclusions developed in the later stages are accurate. Due to the physical nature of wastewater process data, it is recommended that laboratory, operations, and engineering staff be consulted at all points in the process to confirm assumptions.
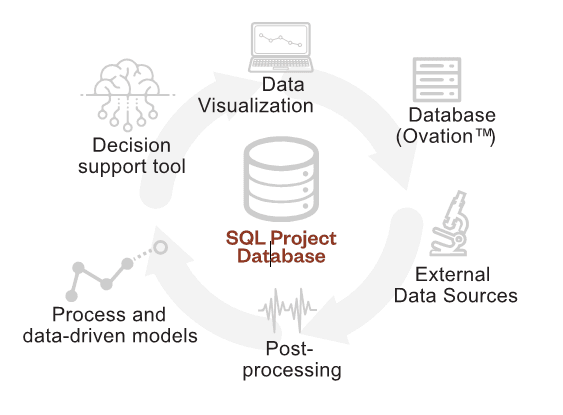
The data collection step identified in the process above is the least glamorous of all the data analyses tasks, but sometimes the most difficult. It is typical at wastewater facilities, and businesses in general, for data to be siloed on different platforms. This complicates the data collection and consolidation efforts due to the requirement for different query languages and sometimes vendor support. The typical approach for a focused data mining effort is to develop a project database consisting of the required subsets of data from each data source. This ensures fast and efficient access to the relevant data for the data analyses tasks at hand. Figure 2 illustrates the typical design of a project database.
After compiling the relevant data from the various data sources, the next step in the analysis process is data validation. At the data validation stage, the engineer must focus on the origins of the data and conceptually consider how to define erroneous data. It is essential that those with an in-depth knowledge of how the data is collected and developed are consulted. For wastewater treatment facilities this includes laboratory and operations staff who are directly involved with the collection and analysis of samples. Without understanding the limitations with the equipment and techniques used to develop the data, an accurate understanding of what information the data is telling us cannot be developed. Figure 3 shows an outlier classification dashboard developed for an analysis of historical flows and loads at a wastewater facility. Essential things to consider in the data validation stage are outlined below:
- Composite versus grab samples
- Exact locations of sample points and process streams that influence data
- Comparison of covariate parameters (e.g. BOD5 and TSS) to separate actual outliers from realistic high and low values
- Visual inspection of long-term trends to identify changes that are not due to physical process changes (e.g. sensor calibration, change in sample point location, process unit coming on-line, etc.)
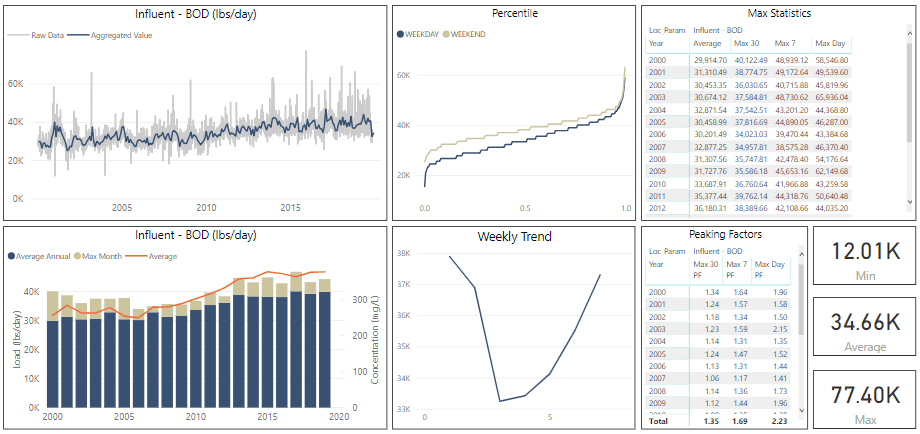
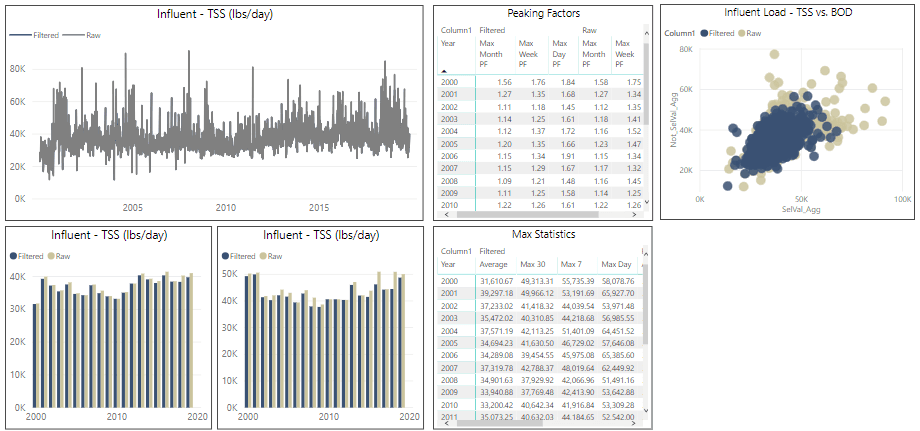
Once the data has been compiled and validated, the data can be explored by operators, engineers, and managers to begin understanding trends, correlation between parameters, and historical benchmarks. This process involves the development of statistical measures and powerful, intuitive visualization dashboards. At this point in the process the most valuable tool remains the intuition and experience of the managers, engineers, and operators of the wastewater treatment facilities. Figure 4 illustrates a typical exploratory data analysis dashboard. The format allows treatment plant staff to quickly understand trends and export key performance metrics for further analysis and comparison to design parameters.
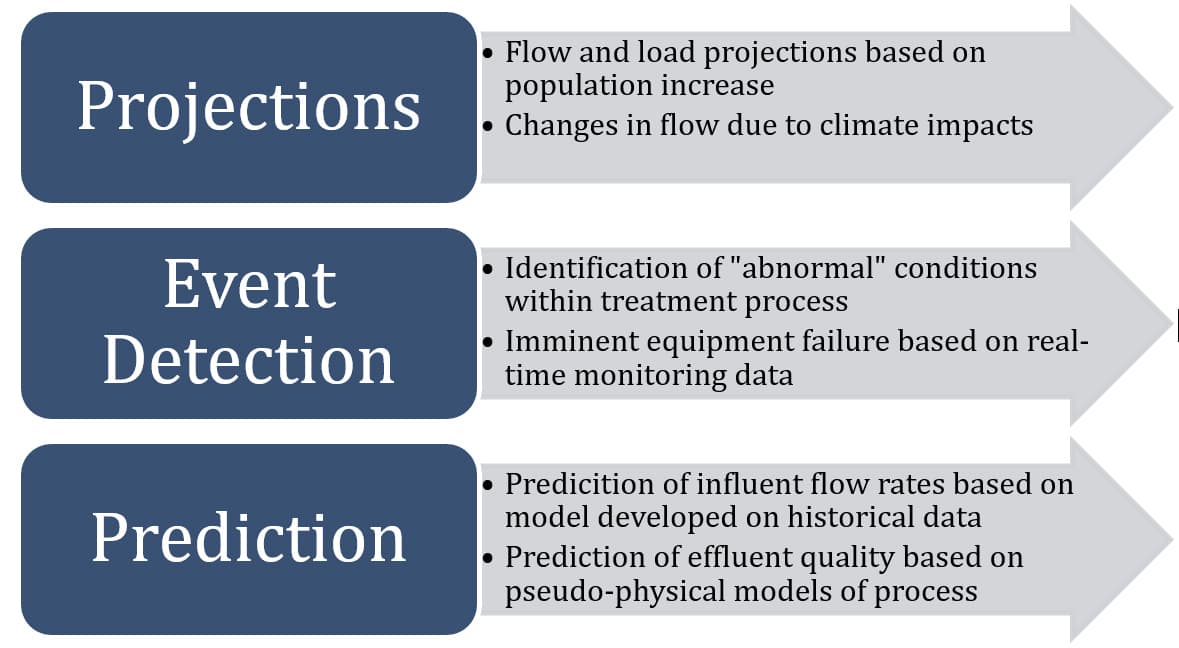
Following an understanding of over-arching trends, models can begin to be developed using the validated data to aid in the projection and prediction of parameters of interest. The purpose of models can vary, but typically fall into the categories identified in Figure 5.
The new and powerful data mining tools on the market today can benefit the water- and wastewater industry greatly. However, the implementation of these tools must be closely considered up front, and the limitations of these systems must be understood by employees across the organization. While companies specializing in data science will focus on flashy algorithms and buzzwords, effective data analysis requires a methodical and logical approach that closely considers the origins and constraints of the data sets up front. In fact, the institutional knowledge held by operations and engineering staff is the greatest asset that utilities have in developing actionable metrics and information from their process data. The implementation of programs to focus on data should be considered holistically and should be viewed as long-term changes in the way an organization functions, as opposed to quick fixes to solve immediate problems.